Stock Analysis · Capital Southwest Corporation (CSWC)
Overview
Capital Southwest Corporation is a business development company, or BDC. In simple terms, it provides financing to smaller private businesses in the United States, mainly lower middle-market companies that are often too small to access public bond markets easily. Its capital is usually used for acquisitions, growth projects, recapitalizations, and general corporate purposes. In addition to lending, Capital Southwest can also take equity stakes, which gives it some upside if portfolio companies grow in value.
The business is built around earning income from its investment portfolio. The largest source of revenue is typically interest income from debt investments, especially first-lien and second-lien loans. A smaller portion comes from dividend income, fee income tied to deal activity or prepayments, and realized or unrealized gains on equity and warrant positions. Based on the company’s recent filings and portfolio disclosures, the revenue mix is best understood as follows:
- Interest income from debt investments: approximately 75% to 85% of recurring investment income. This is the core of the model and mainly reflects loans made to portfolio companies.
- Dividend income and other investment income: approximately 5% to 15%. This can include recurring dividends from certain structured investments and fees earned when loans are originated, repaid early, or amended.
- Realized and unrealized gains: highly variable, often 0% to 20% or more of total reported revenue in a given period. This reflects changes in the valuation of equity holdings and gains or losses when investments are sold.
What matters most for long-term analysis is that Capital Southwest is primarily an income-producing lender with some equity upside layered on top. That makes the company more dependent on credit quality, interest rates, and deal discipline than on broad consumer demand.
The recent income flow also shows a meaningful expansion in total revenue and operating income over the last few years, with especially strong growth into fiscal 2026. At the same time, interest expense has also risen, which is normal for a lender that uses debt financing to expand its portfolio. The company has remained highly profitable on an operating basis despite that increase in funding costs.
Key Figures
| Metric | Value | Sector ⓘ |
|---|---|---|
| Date | Oct 03, 2026 | |
| Context | ||
| Sector | Financial Services | |
| Industry | Asset Management | |
| Market Cap ⓘ | $1.47B | |
| Beta ⓘ | 0.74 | |
Value (Cheapness) | ||
| P/E Ratio ⓘ | 12.92 | 12.60 |
| P/B Ratio ⓘ | 1.55 | 1.23 |
| FCF Yield ⓘ | -12.06% | 10.16% |
| Dividend Yield ⓘ | 9.95% | 2.96% |
| EBIT / EV ⓘ | 5.70% | 7.77% |
| PEG ⓘ | 12.54 | |
Growth (Business expansion) | ||
| Revenue Growth ⓘ | 9.10% | 9.50% |
| RPS Growth (5Y CAGR) ⓘ | -4.58% | 12.10% |
| EPS Growth (5Y CAGR) ⓘ | -32.36% | -9.45% |
| BVPS Growth (5Y CAGR) ⓘ | -4.45% | 5.01% |
| Margin Growth (5Y Trend) ⓘ | 30.49% | -4.07% |
| FCF Growth (5Y CAGR) ⓘ | N/A | 4.96% |
| DPS Growth (5Y CAGR) ⓘ | -3.38% | 8.79% |
Quality (Business durability) | ||
| ROIC (Latest) ⓘ | 6.90% | 9.60% |
| ROE (Latest) ⓘ | 11.04% | 13.84% |
| ROA (Latest) ⓘ | 5.11% | 1.53% |
| ROIC (5Y Median) ⓘ | 5.14% | 7.86% |
| ROE (5Y Median) ⓘ | 11.31% | 12.20% |
| ROA (5Y Median) ⓘ | 5.01% | 1.29% |
| Net Debt / EBIT (Latest) ⓘ | 2.82 | 0.91 |
| Net Debt / EBIT (5Y Median) ⓘ | 11.04 | 0.74 |
| Net Debt / EBITDA (Latest) ⓘ | 2.70 | 0.97 |
| Operating Margin (Latest) ⓘ | 65.56% | 22.12% |
| Operating Margin (5Y Median) ⓘ | 48.48% | 24.39% |
| Debt to Equity (Latest) ⓘ | 45.71% | 60.37% |
| Profit Margin (Latest) ⓘ | 46.68% | 26.62% |
| Free Cash Flow (Latest) ⓘ | -$177.81M | |
Momentum (Price trend) | ||
| 3Y Return ⓘ | +45.24% | +89.23% |
| 12M Return (excl. last month) ⓘ | +21.70% | +17.35% |
| 6M Return ⓘ | +12.08% | +10.00% |
| Price vs. 200-Day MA ⓘ | +4.18% | +3.73% |
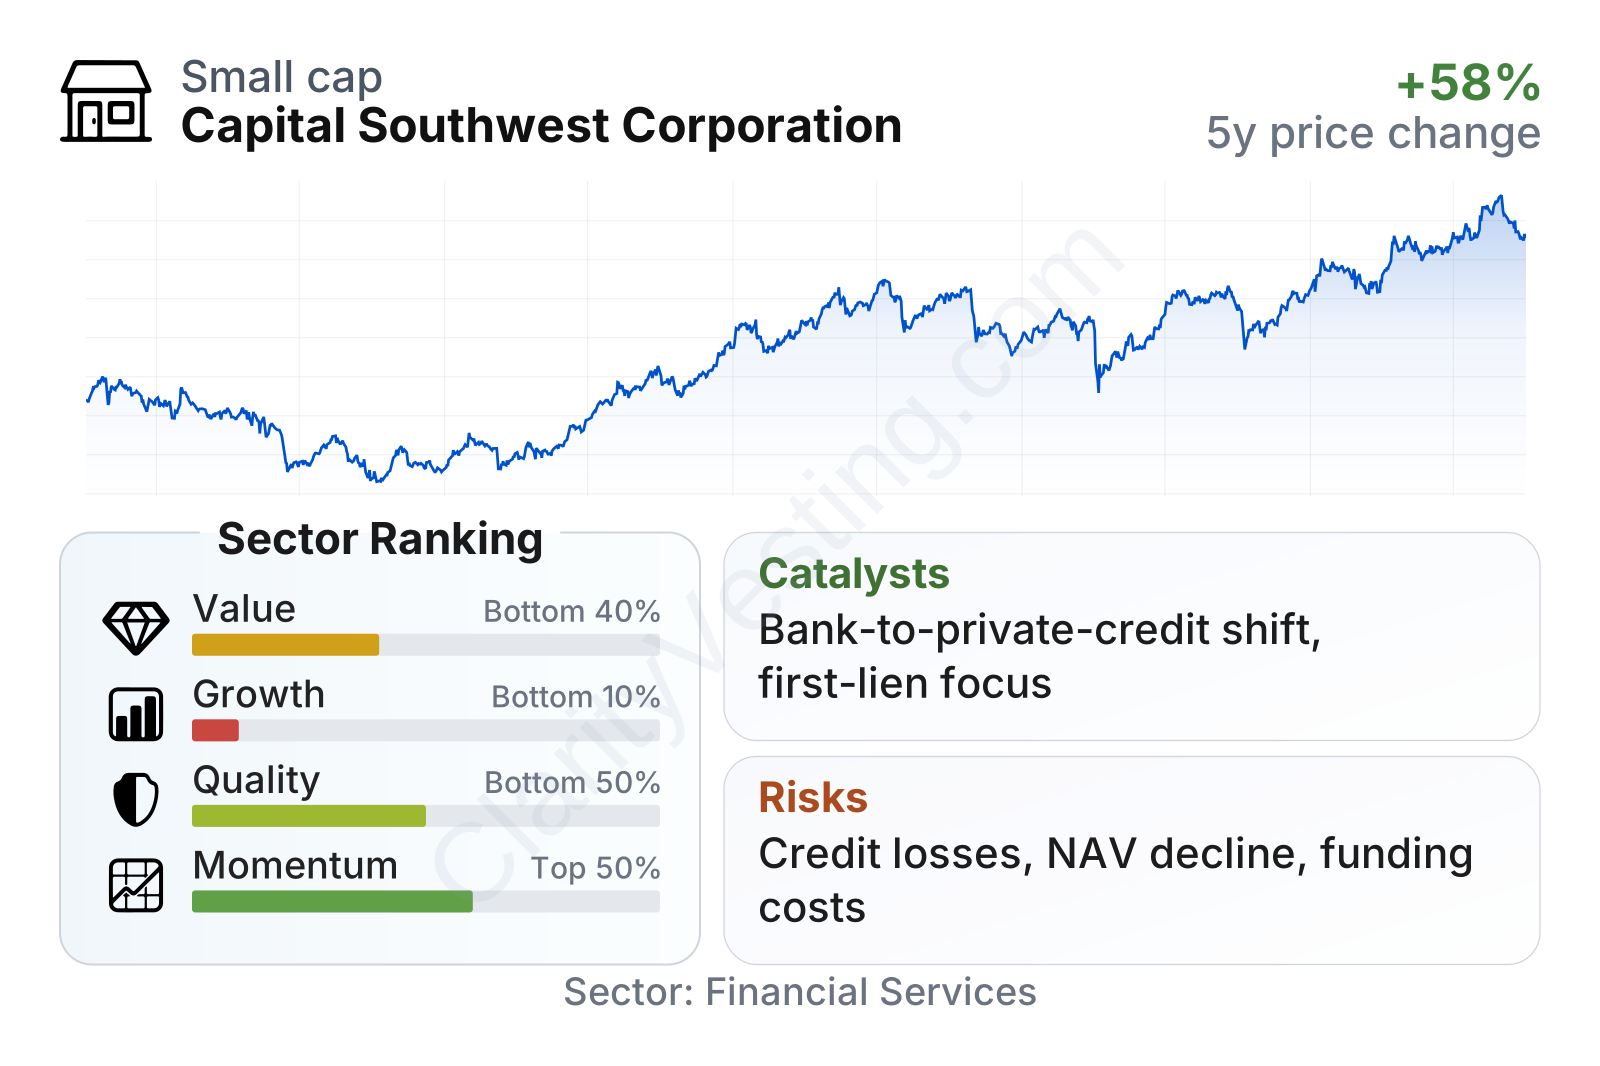
Capital Southwest is a relatively small public financial company, with a market value around $1.5 billion and a stock that has historically moved less than the broader market, as shown by its beta below 1. The factor breakdown suggests a mixed profile. Quality metrics are generally solid, supported by strong margins and asset efficiency, while growth metrics rank weakly versus the broader financial sector. Value indicators are near sector norms on earnings, but not especially cheap on book value. Momentum has been acceptable over the last year, although longer-term share performance has lagged many peers in the sector.
The stock price path also shows that the company recovered strongly from its 2022 trough and reached new highs by 2026. That recovery has come alongside a declining dividend yield, which usually means the share price has risen faster than the dividend distribution.
Growth
Capital Southwest operates in a part of the credit market that continues to attract demand. Lower middle-market businesses still need flexible financing, and traditional banks have become more selective in many lending categories. That has helped private credit firms and BDCs gain market share. This is a favorable backdrop for companies with established sourcing relationships, disciplined underwriting, and access to capital.
The company’s strategy makes sense in that context. Capital Southwest has focused on senior secured lending, especially first-lien loans, which generally sit higher in the repayment order if a borrower gets into trouble. That approach is less aggressive than relying heavily on subordinated debt or equity gains. It may limit some upside in boom periods, but it can improve resilience over a full cycle.
Another growth support is scale. As a lender gets larger, it can spread operating costs over a broader investment base and improve access to funding sources. Capital Southwest’s revenue has expanded meaningfully in recent years, and operating margins have improved over time, which suggests the platform has become more efficient as it grew.
Earnings per share rose materially from fiscal 2022 through fiscal 2024, then softened in fiscal 2025 and fiscal 2026. That pattern suggests the company benefited from strong portfolio growth and favorable lending conditions, but more recently faced some pressure from funding costs, portfolio marks, or normal credit-cycle moderation. The key point is that earnings remain positive and relatively stable, but the rapid expansion phase appears to have cooled.
Book value per share deserves close attention for any BDC because it represents the value of the investment portfolio after liabilities. Here, the trend has moved down over the last several years after an earlier increase. That does not automatically signal a problem, because BDCs distribute a large share of income and can experience valuation changes from quarter to quarter. Still, a declining book value over multiple years means long-term growth has not been consistently converted into higher net asset value per share.
As for recent opportunities, one of the clearest catalysts is the continued shift from banks toward private credit providers. If that trend persists, Capital Southwest should keep seeing lending opportunities in its target market. Its focus on sponsor-backed and directly originated deals may also support portfolio expansion if underwriting standards remain disciplined.
Risks
This article is for informational purposes only and does not constitute financial advice. Some content is AI-generated. See Disclaimer


