Stock Analysis · CSW Industrials Inc (CSW)
Overview
CSW Industrials is a diversified industrial products company that sells specialized items used in building maintenance, repair, and construction, as well as products for industrial equipment and energy-related applications. Its business is not centered on large one-off capital projects; instead, a meaningful part of demand comes from recurring maintenance and replacement activity. That matters because repair-driven sales are often steadier than purely new-construction demand.
The company organizes its business into three operating segments. Based on the latest annual filing for fiscal 2026, revenue is spread approximately as follows:
- Contractor Solutions: about 70% of revenue. This is the largest business and includes HVAC/R chemicals, sealants, adhesives, flashing, duct and air movement accessories, and plumber-oriented products sold under brands such as RectorSeal, Aspen, and others. This segment is tied to residential and commercial repair, maintenance, and installation activity.
- Specialized Reliability Solutions: about 17% of revenue. This unit sells highly engineered products used to improve reliability, lubrication, sealing, and performance in industrial settings.
- Engineered Building Solutions: about 13% of revenue. This segment supplies code-driven and specification-based products for commercial buildings, including fire and smoke protection, architecturally specified building products, and related applications.
CSW’s model combines branded niche products, distribution relationships, and bolt-on acquisitions. Over the last several years, the company has expanded revenue while keeping operating profitability at a healthy level. The latest full-year picture also shows a bigger business with higher gross profit than a few years ago, although recent net income has been pressured by higher interest expense and integration-related costs.
The overall financial flow shows a business that has scaled meaningfully since fiscal 2022: revenue and gross profit have both moved up strongly, and operating income has also increased. The weaker point in the latest year is that a larger portion of earnings is being absorbed below the operating line, especially from higher interest expense, which helps explain why net income did not rise in step with revenue.
Key Figures
| Metric | Value | Sector ⓘ |
|---|---|---|
| Date | Oct 24, 2026 | |
| Context | ||
| Sector | Industrials | |
| Industry | Specialty Industrial Machinery | |
| Market Cap ⓘ | $4.72B | |
| Beta ⓘ | 0.81 | |
Value (Cheapness) | ||
| P/E Ratio ⓘ | 39.69 | 22.29 |
| P/B Ratio ⓘ | 4.55 | 1.98 |
| FCF Yield ⓘ | 3.06% | 6.26% |
| Dividend Yield ⓘ | 0.39% | 1.92% |
| EBIT / EV ⓘ | 3.66% | 4.83% |
| PEG ⓘ | 2.84 | |
Growth (Business expansion) | ||
| Revenue Growth ⓘ | 33.00% | 9.30% |
| RPS Growth (5Y CAGR) ⓘ | 13.07% | 7.76% |
| EPS Growth (5Y CAGR) ⓘ | -12.79% | -13.17% |
| BVPS Growth (5Y CAGR) ⓘ | 20.09% | 6.13% |
| Margin Growth (5Y Trend) ⓘ | 1.45% | 0.74% |
| FCF Growth (5Y CAGR) ⓘ | 25.46% | 10.79% |
| DPS Growth (5Y CAGR) ⓘ | 15.86% | 9.41% |
Quality (Business durability) | ||
| ROIC (Latest) ⓘ | N/A | 10.75% |
| ROA (Latest) ⓘ | 6.28% | 5.41% |
| ROIC (5Y Median) ⓘ | N/A | 9.37% |
| ROA (5Y Median) ⓘ | 9.46% | 4.95% |
| Net Debt / EBIT (Latest) ⓘ | 3.89 | 2.04 |
| Net Debt / EBIT (5Y Median) ⓘ | 2.16 | 2.27 |
| Net Debt / EBITDA (Latest) ⓘ | 2.87 | 1.39 |
| Net Debt / Assets ⓘ | 34.62% | 19.27% |
| EBITDA / Interest ⓘ | 8.29 | 9.58 |
| Operating Margin (Latest) ⓘ | 17.74% | 10.49% |
| Operating Margin (5Y Median) ⓘ | 18.34% | 10.30% |
| Debt to Equity (Latest) ⓘ | 79.68% | 64.82% |
| Profit Margin (Latest) ⓘ | 10.34% | 6.67% |
| Free Cash Flow (Latest) ⓘ | $144.28M | |
Momentum (Price trend) | ||
| 3Y Return ⓘ | +70.10% | +67.77% |
| 12M Return (excl. last month) ⓘ | +13.21% | +12.05% |
| 6M Return ⓘ | -2.26% | 0.00% |
| Price vs. 200-Day MA ⓘ | +0.70% | +0.67% |
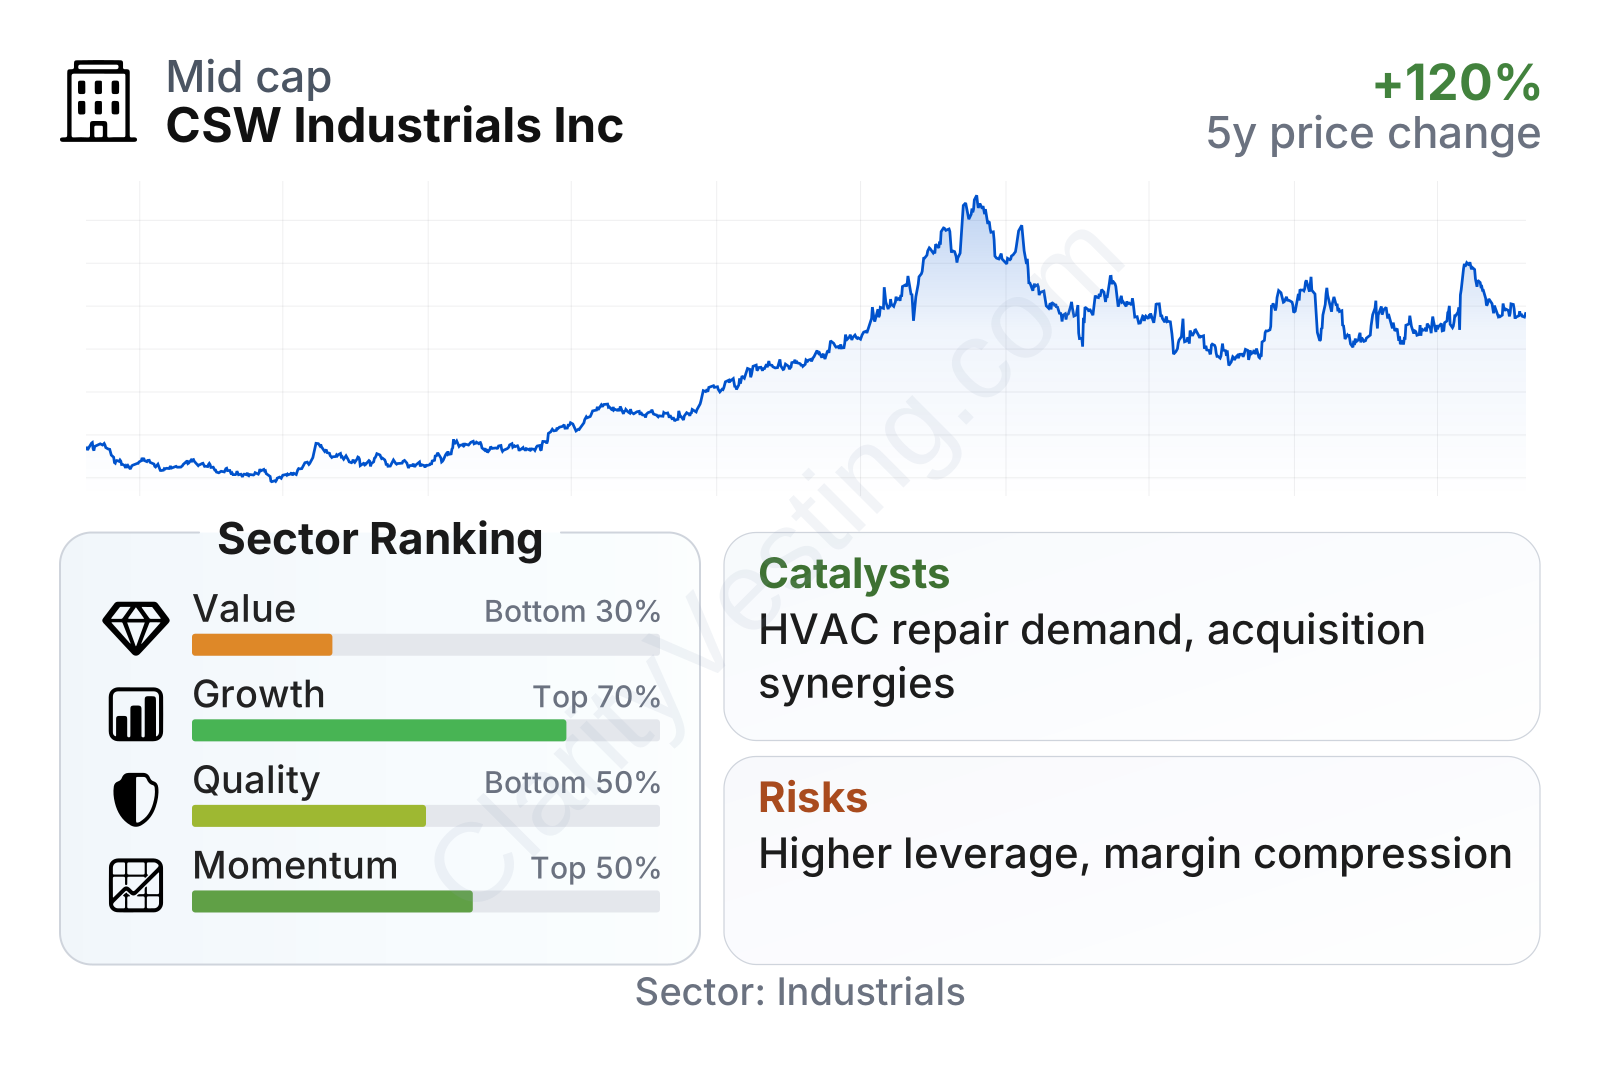
CSW Industrials is a mid-sized industrial company with a relatively low share-price volatility profile, reflected in a beta below 1. On growth, it ranks well versus much of the industrial sector, supported by strong recent sales expansion, solid multi-year revenue growth per share, and notably strong free cash flow growth over five years. Profitability is also better than the sector median in several areas, especially operating margin and net margin.
The more demanding part of the profile is valuation. The stock trades at noticeably higher earnings and book-value multiples than the sector median, while its free cash flow yield is lower. In other words, the market is already assigning a premium to the company’s quality of execution and growth record.
Growth
CSW Industrials operates in segments that benefit from several durable themes: HVAC system maintenance, building safety requirements, water-related repair products, industrial reliability, and code-compliant commercial construction materials. These are not flashy markets, but they can be attractive because many purchases are essential rather than optional. Aging building stock in the United States, tighter building standards, and demand for repair and replacement work all support long-term industry relevance.
The company’s strategy also appears coherent. Management has built around specialized products with recognized brands and has repeatedly used acquisitions to broaden distribution and add adjacent categories. That approach can work well in industrial niches because small product lines with strong customer loyalty can become more valuable when placed inside a larger distribution network.
Recent sales momentum has clearly accelerated again. After a slower stretch in fiscal 2023 and early fiscal 2025, year-over-year growth moved back into a much stronger range, recently around the low-30% area. That is far above the sector median and suggests that acquisitions and commercial execution are currently adding meaningful scale.
Cash generation is another important support for the growth case. Free cash flow has risen sharply over the last five years, even though the latest trailing figure sits below the recent peak. The broader trend still points to a company that has become materially better at converting its larger revenue base into cash, which helps fund acquisitions, debt service, and dividends.
A notable recent catalyst is the company’s expansion through acquisitions, particularly in Contractor Solutions, where scale and cross-selling opportunities are strongest. Recent filings and investor materials indicate that acquired businesses are helping push revenue above the $1 billion mark. If integration goes smoothly, that creates room for broader product bundles and deeper distributor relationships. Another favorable element is exposure to HVAC and plumbing repair channels, which tend to be less cyclical than pure new construction.
Risks
This article is for informational purposes only and does not constitute financial advice. Some content is AI-generated. See Disclaimer


