Stock Analysis · Castle Biosciences Inc (CSTL)
Overview
Castle Biosciences is a molecular diagnostics company focused on tests that help physicians assess cancer risk, guide treatment decisions, and monitor patients over time. Its business is built around proprietary tests sold primarily to clinicians treating skin cancers, Barrett’s esophagus, and certain rare or difficult-to-manage conditions. In simple terms, the company earns money when doctors order its laboratory-developed tests and payers reimburse those tests.
The company’s revenue base is still heavily centered on dermatology, especially tests linked to melanoma and other skin cancers, but it has broadened into gastroenterology and tissue-based diagnostics through acquisitions and product launches. Based on recent company filings, the mix appears to be concentrated in a few named franchises, with DecisionDx-Melanoma remaining the largest single contributor, followed by newer growth drivers such as the company’s tissue-based products and Barrett’s esophagus-related testing.
The main revenue sources can be summarized as follows:
- DecisionDx-Melanoma: approximately 35% to 45% of revenue in recent periods. This is the company’s best-known test and is used to classify recurrence risk in patients with cutaneous melanoma.
- TissueCypher / gastroenterology-related testing: approximately 20% to 30%. This business supports risk stratification in Barrett’s esophagus and became more important after Castle expanded beyond dermatology.
- MyPath and other dermatology / skin cancer tests including DecisionDx-SCC, DecisionDx-UM, DecisionDx DiffDx-Melanoma and related offerings: approximately 20% to 30% combined. These tests address squamous cell carcinoma, uveal melanoma, diagnostically uncertain melanocytic lesions, and other specialized skin cancer use cases.
- Other services and smaller product lines: approximately 5% to 10%. This includes lower-volume offerings and any residual revenue streams outside the main franchises.
This structure matters because it shows both the opportunity and the dependency: Castle is no longer a one-product business, but a large share of revenue still depends on a limited number of reimbursed diagnostics.
The financial profile over the last several years shows a business that scaled revenue quickly and reached profitability in 2024 before slipping back into losses in 2025 as expenses rose faster than sales. Gross profit remains strong, which is typical for specialized diagnostics, but commercial and operating costs remain the key swing factor for earnings.
The pattern is clear: revenue expanded sharply from 2021 through 2025, gross margins stayed attractive, and the main pressure point has been operating expenses, especially sales, administrative, and product-development spending.
Key Figures
| Metric | Value | Sector ⓘ |
|---|---|---|
| Date | Oct 17, 2026 | |
| Context | ||
| Sector | Healthcare | |
| Industry | Diagnostics & Research | |
| Market Cap ⓘ | $1.01B | |
| Beta ⓘ | 0.94 | |
Value (Cheapness) | ||
| P/E Ratio ⓘ | N/A | 24.79 |
| P/B Ratio ⓘ | 2.19 | 3.08 |
| FCF Yield ⓘ | -0.05% | 3.15% |
| Dividend Yield ⓘ | N/A | 1.94% |
| EBIT / EV ⓘ | -2.25% | 0.57% |
| PEG ⓘ | N/A | |
Growth (Business expansion) | ||
| Revenue Growth ⓘ | 20.10% | 7.45% |
| RPS Growth (5Y CAGR) ⓘ | 33.46% | 8.61% |
| EPS Growth (5Y CAGR) ⓘ | -33.47% | -17.81% |
| BVPS Growth (5Y CAGR) ⓘ | -0.21% | 3.72% |
| Margin Growth (5Y Trend) ⓘ | N/A | -0.62% |
| FCF Growth (5Y CAGR) ⓘ | N/A | 1.04% |
| DPS Growth (5Y CAGR) ⓘ | N/A | 6.77% |
Quality (Business durability) | ||
| ROIC (Latest) ⓘ | -3.08% | 3.24% |
| ROA (Latest) ⓘ | -3.45% | 3.01% |
| ROIC (5Y Median) ⓘ | -7.54% | 4.60% |
| ROA (5Y Median) ⓘ | -6.94% | 1.89% |
| Net Debt / EBIT (Latest) ⓘ | N/A | 1.34 |
| Net Debt / EBIT (5Y Median) ⓘ | N/A | 1.84 |
| Net Debt / EBITDA (Latest) ⓘ | N/A | 1.00 |
| Net Debt / Assets ⓘ | -4.54% | 5.45% |
| EBITDA / Interest ⓘ | N/A | 9.64 |
| Operating Margin (Latest) ⓘ | -5.27% | 9.27% |
| Operating Margin (5Y Median) ⓘ | -26.10% | 7.38% |
| Debt to Equity (Latest) ⓘ | 7.80% | 28.58% |
| Profit Margin (Latest) ⓘ | -5.43% | 3.59% |
| Free Cash Flow (Latest) ⓘ | -$489.00K | |
Momentum (Price trend) | ||
| 3Y Return ⓘ | +153.18% | +42.80% |
| 12M Return (excl. last month) ⓘ | +64.20% | +18.50% |
| 6M Return ⓘ | +37.29% | +7.57% |
| Price vs. 200-Day MA ⓘ | +17.30% | +5.12% |
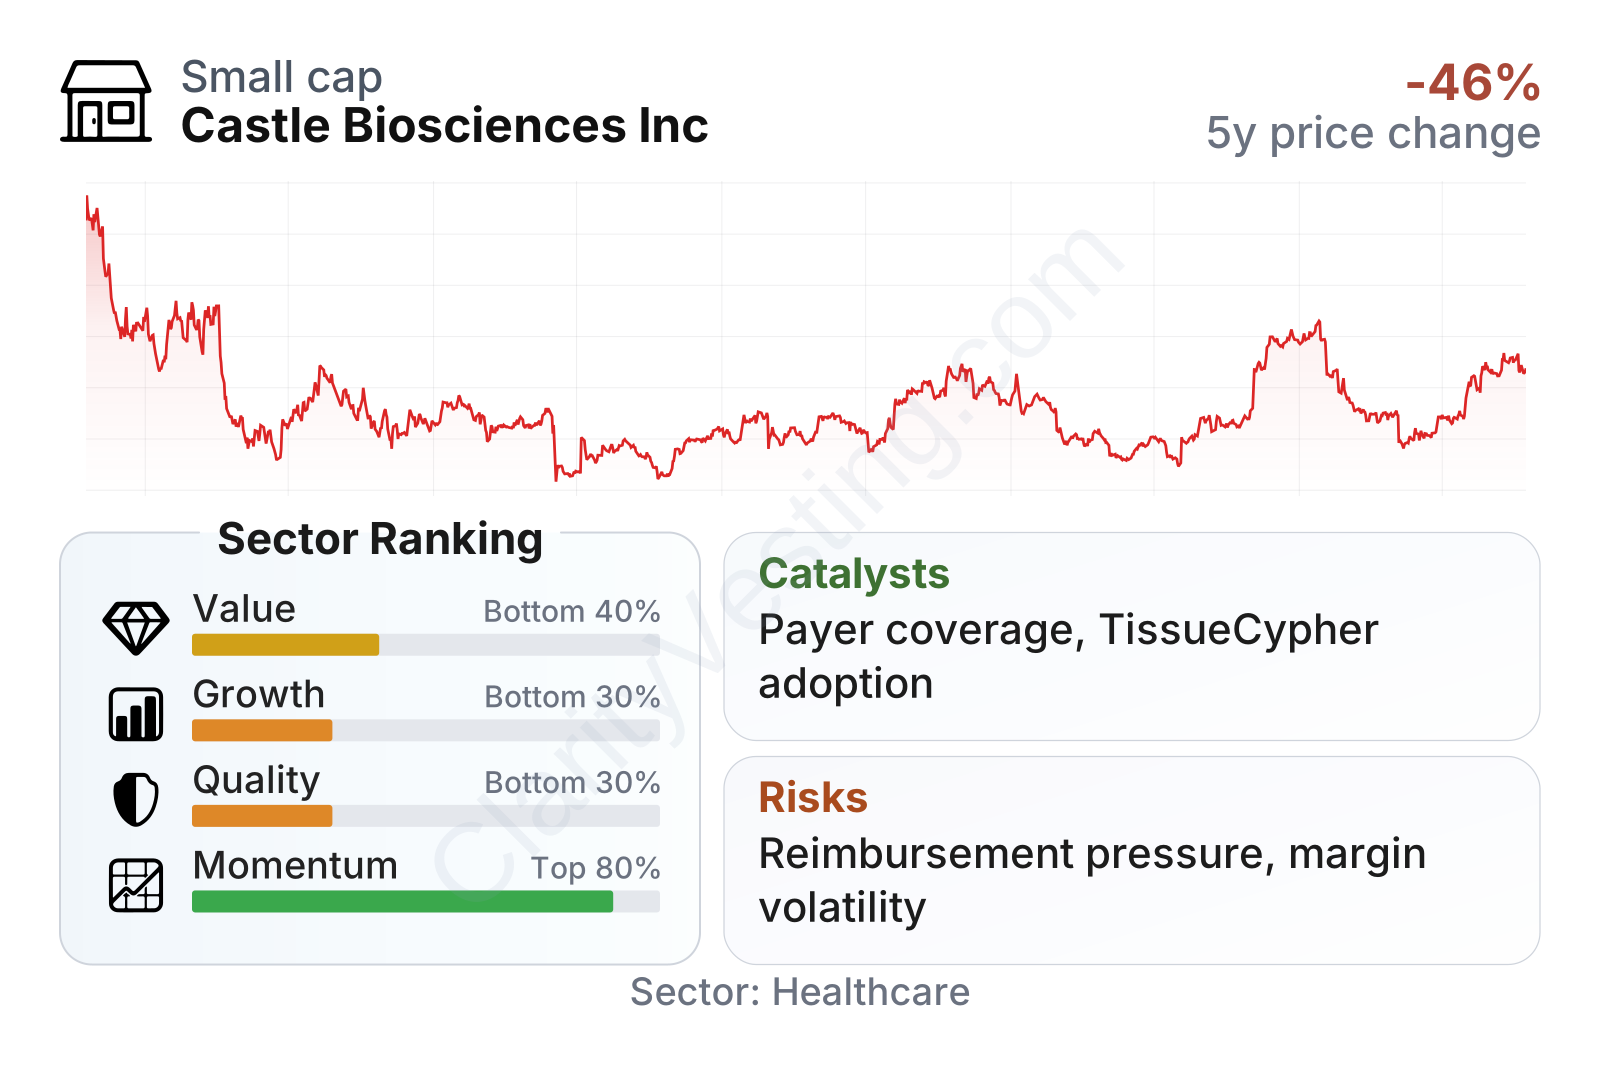
Castle Biosciences is a small-cap healthcare company with stock volatility close to the broader market rather than extreme biotech-like swings. The table shows a mixed profile: recent revenue growth remains well above the sector median, but profitability, returns on capital, and cash generation are weaker than the typical healthcare peer. Momentum has been relatively strong, while value metrics are harder to interpret because earnings remain inconsistent.
The share price history also reflects that uneven path. The stock fell sharply from 2021 highs, recovered strongly into parts of 2024 and early 2026, and then gave back a portion of those gains. That kind of movement usually signals that the market is still debating whether Castle can convert good top-line growth into durable earnings.
Growth
Castle operates in a part of healthcare that still has room to expand. Precision diagnostics is a growing field because doctors and payers increasingly want more targeted information rather than relying only on traditional pathology or broad treatment rules. In cancer care especially, tests that help identify recurrence risk or clarify diagnosis can become embedded in clinical workflows if they show medical usefulness and secure reimbursement.
Castle’s strategy is logical for that environment. Instead of trying to become a broad laboratory conglomerate, it has focused on narrower disease areas where specialized molecular testing can influence real decisions. That approach can support pricing power, physician loyalty, and recurring test volume if clinical adoption continues.
Revenue growth has been strong over the medium term, although the pace has become more uneven lately. The company previously posted very high growth rates, then saw a meaningful slowdown and some negative year-over-year quarters before returning to growth around 20% most recently. That is still faster than the sector median, but it also suggests Castle is moving from an early hyper-growth phase into a more execution-sensitive stage.
Cash generation improved dramatically from deeply negative levels to positive territory in 2025, then softened again while staying near break-even on a trailing basis. That is an important signal for long-term analysis. It suggests the business model can produce cash, but the margin of safety is not yet wide. Future growth will look more convincing if Castle can pair expanding revenue with steadier cash conversion.
Several potential catalysts stand out. The first is broader reimbursement coverage, because diagnostics businesses often accelerate when more payers consistently cover testing. The second is deeper physician adoption of newer products, especially outside the company’s original melanoma franchise. The third is continued cross-selling: Castle already has relationships with dermatologists and can use that commercial presence to expand test usage across adjacent skin cancer indications.
Recent company updates have also pointed to opportunities in guideline support, evidence generation, and adoption of newer tests. For a diagnostics company, those developments matter because they can strengthen both medical credibility and payer discussions. Castle does not need every product to become a blockbuster; it needs several tests to become routine in focused specialties.
Risks
This article is for informational purposes only and does not constitute financial advice. Some content is AI-generated. See Disclaimer


