Stock Analysis · COSCO SHIPPING Ports Limited (CSPKY)
Overview
COSCO SHIPPING Ports Limited is a port operator tied to the wider COSCO SHIPPING group, one of China’s largest state-owned shipping and logistics networks. Its business is centered on investing in, developing, and operating container terminals. In simple terms, it makes money from the infrastructure that helps move global trade: ships arrive, containers are loaded and unloaded, and ports collect handling and related service fees.
The company’s assets are spread across mainland China and overseas locations, giving it exposure to both domestic trade flows and international shipping routes. This matters because port demand usually follows trade volumes, manufacturing activity, and supply-chain patterns rather than consumer trends alone. The company is not primarily a ship owner; it is more of a port platform that benefits from container throughput, terminal operations, and returns from stakes in multiple port projects.
Based on the company’s annual reporting structure, revenue is mainly generated from port and terminal-related activities, while profit also includes contributions from associates and joint ventures. A simple breakdown of the business looks like this:
- Terminal operations and related services: the large majority of reported revenue, roughly 85% to 95%. This includes container handling, berth services, yard operations, storage, and other port service income.
- Ancillary port-related activities: a smaller share, roughly 5% to 15%. This can include logistics support, terminal management services, and other related operational income depending on the reporting period and asset mix.
- Share of profits from associates and joint ventures: not recorded as revenue in the usual sense, but important for overall earnings. This reflects the company’s stakes in many terminals it does not fully own and helps explain why net profit can remain solid even when direct operating trends are mixed.
Over the last several years, the business has shown a gradual rise in total revenue, but with pressure on operating profit conversion more recently. Revenue has moved from a little above $1.2 billion in 2021 to around $1.7 billion in 2025, while net income stayed relatively resilient near the low-$300 million range. That pattern suggests a business with stable asset value and earnings support from investments, but also one facing cost pressure and a more complex operating mix.
The long-term pattern points to improving scale, but not to straight-line operating leverage. Sales have increased, while interest costs and operating expenses have remained meaningful, which is important when judging how much of future growth will actually reach shareholders as profit and cash flow.
Key Figures
| Metric | Value | Sector ⓘ |
|---|---|---|
| Date | Oct 10, 2026 | |
| Context | ||
| Sector | Industrials | |
| Industry | Marine Shipping | |
| Market Cap ⓘ | $2.96B | |
| Beta ⓘ | 1.05 | |
Value (Cheapness) | ||
| P/E Ratio ⓘ | 8.01 | 22.32 |
| P/B Ratio ⓘ | 0.43 | 1.98 |
| FCF Yield ⓘ | 0.88% | 6.34% |
| Dividend Yield ⓘ | 4.96% | 1.95% |
| EBIT / EV ⓘ | N/A | 4.71% |
| PEG ⓘ | 1.11 | |
Growth (Business expansion) | ||
| Revenue Growth ⓘ | 14.10% | 9.25% |
| RPS Growth (5Y CAGR) ⓘ | 4.55% | 7.75% |
| EPS Growth (5Y CAGR) ⓘ | -11.63% | -13.37% |
| BVPS Growth (5Y CAGR) ⓘ | -5.88% | 6.12% |
| Margin Growth (5Y Trend) ⓘ | -36.35% | 0.81% |
| FCF Growth (5Y CAGR) ⓘ | 87.88% | 11.01% |
| DPS Growth (5Y CAGR) ⓘ | -38.40% | 9.48% |
Quality (Business durability) | ||
| ROIC (Latest) ⓘ | N/A | 10.70% |
| ROA (Latest) ⓘ | 2.82% | 5.38% |
| ROIC (5Y Median) ⓘ | 5.56% | 9.26% |
| ROA (5Y Median) ⓘ | 2.63% | 4.94% |
| Net Debt / EBIT (Latest) ⓘ | N/A | 2.08 |
| Net Debt / EBIT (5Y Median) ⓘ | 4.87 | 2.29 |
| Net Debt / EBITDA (Latest) ⓘ | 6.85 | 1.43 |
| Net Debt / Assets ⓘ | 19.67% | 19.34% |
| EBITDA / Interest ⓘ | N/A | 9.54 |
| Operating Margin (Latest) ⓘ | N/A | 10.34% |
| Operating Margin (5Y Median) ⓘ | 40.82% | 10.29% |
| Debt to Equity (Latest) ⓘ | 57.57% | 65.52% |
| Profit Margin (Latest) ⓘ | 20.58% | 6.63% |
| Free Cash Flow (Latest) ⓘ | $25.98M | |
Momentum (Price trend) | ||
| 3Y Return ⓘ | +67.04% | +61.33% |
| 12M Return (excl. last month) ⓘ | -5.45% | +14.82% |
| 6M Return ⓘ | +19.28% | +3.53% |
| Price vs. 200-Day MA ⓘ | +17.84% | +0.88% |
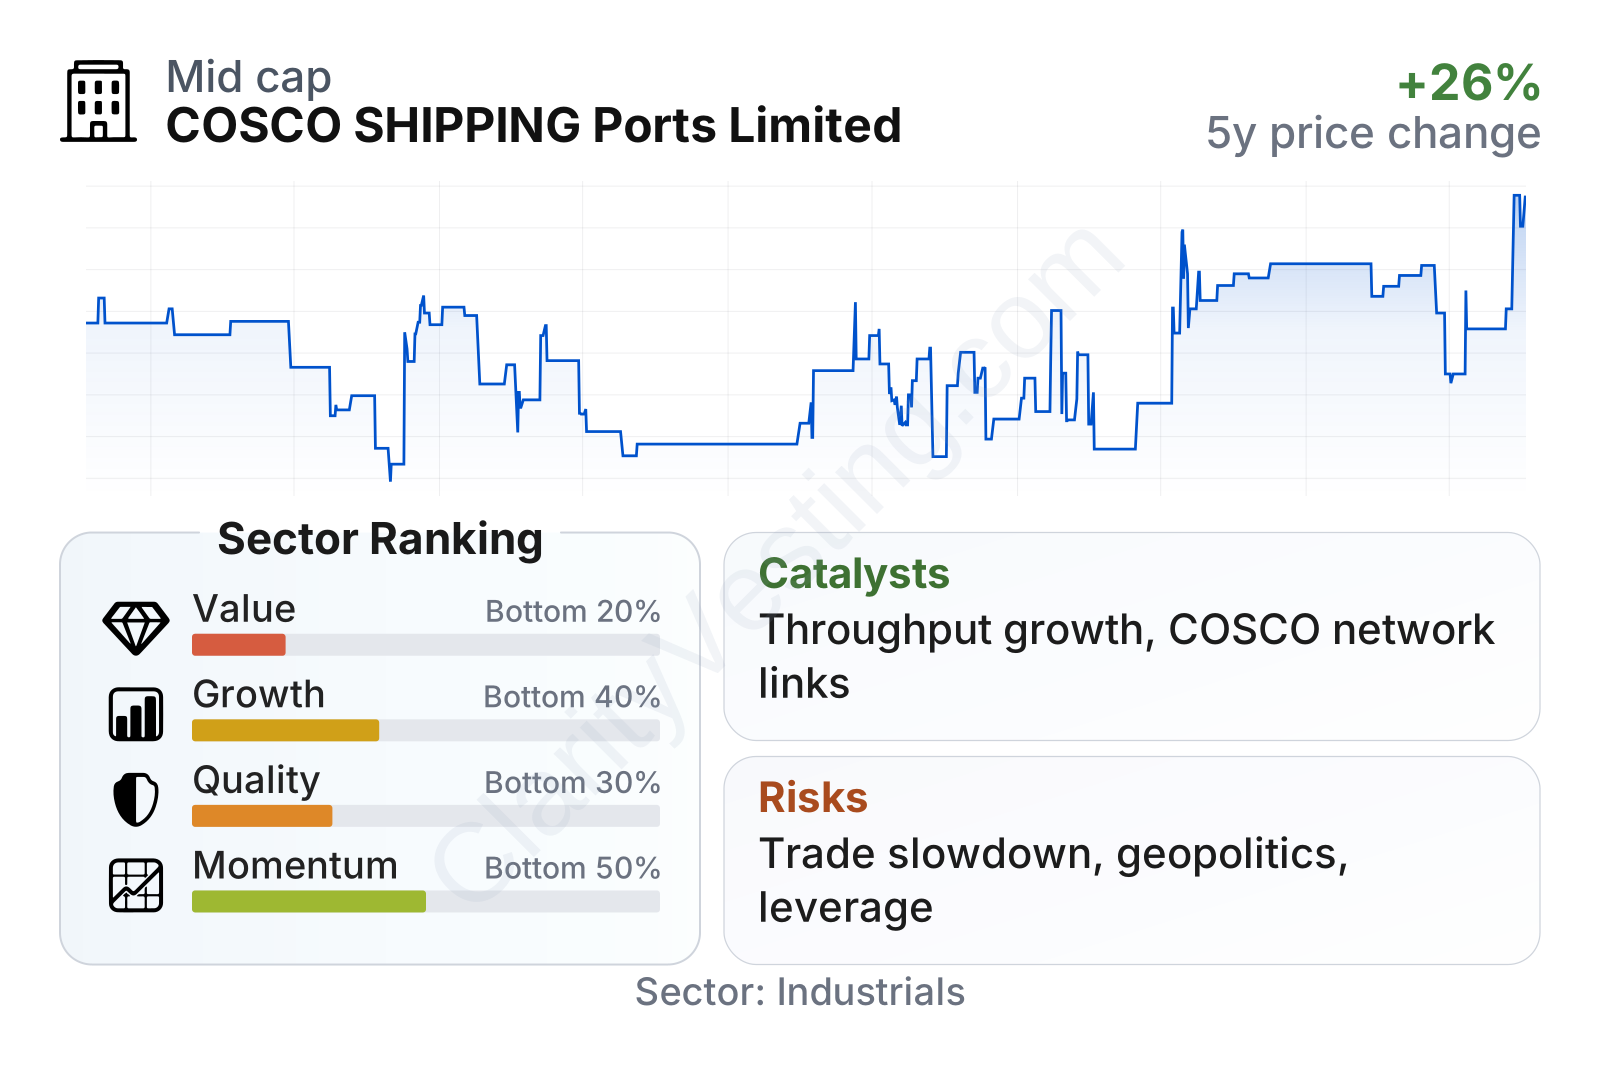
COSCO SHIPPING Ports is a mid-sized listed port operator with market behavior close to the broader market in volatility terms. On valuation, the shares trade at clearly lower earnings and book multiples than the typical company in its sector, while the dividend yield stands noticeably above the sector median. That said, the table also shows why the discount exists: quality and growth ranks sit in the lower part of the sector, and free cash flow yield is not especially strong. In other words, the market is recognizing the company’s asset base and earnings, but it is not assigning a premium to growth quality or capital efficiency.
Growth
Port infrastructure remains tied to a sector with long-term structural relevance. Even with trade cycles, geopolitical friction, and periodic shipping slowdowns, container ports remain essential nodes in global commerce. Over time, growth in Asian trade, regional supply-chain shifts, and the need for more efficient logistics networks support the general industry outlook. This does not make the sector fast-growing every year, but it does give large port networks lasting strategic importance.
For COSCO SHIPPING Ports, the logic of the strategy is clear. The company is positioned around a network model: own or co-own terminals in key gateways, link them to shipping line demand from the wider COSCO ecosystem, and expand throughput through scale and connectivity. That approach can create durable traffic flows because a shipping group with global reach has an incentive to direct volumes through affiliated infrastructure where possible.
Recent revenue growth has turned positive again after a softer patch in 2023. The latest year-over-year readings are in the low-teens, which is better than the sector median and indicates that business momentum has improved. The weaker part is that five-year growth trends still look less impressive than the recent rebound, meaning the current acceleration still needs to prove it is sustainable over a full cycle.
A major growth catalyst is the company’s exposure to port projects connected to Chinese trade routes and international logistics corridors. New capacity, higher utilization at existing terminals, and efficiency upgrades can all support future earnings. Another potential driver is the continued normalization and rerouting of global shipping networks, which can shift traffic toward operators with broad geographic exposure and strong parent-group links.
Recent company updates have also emphasized throughput performance across major terminals and ongoing portfolio optimization. For a port business, those two points matter more than headlines alone: rising container volumes support revenue, while disciplined asset management can improve returns from a large terminal portfolio that includes both controlled subsidiaries and minority stakes.
Risks
This article is for informational purposes only and does not constitute financial advice. Some content is AI-generated. See Disclaimer


