Stock Analysis · COSCO SHIPPING Ports Limited (CSPKF)
Overview
COSCO SHIPPING Ports Limited is a port infrastructure and terminal operator within the broader COSCO SHIPPING group. In simple terms, the company owns and operates container terminals where ships load and unload cargo, and it also holds stakes in many terminals run with partners. Its network is heavily tied to China’s trade flows, but it also has assets in other parts of Asia, Europe, the Mediterranean, the Middle East, South America, and Africa. That gives the business exposure to global container shipping rather than to one single port.
The company makes money mainly from container terminal operations. A large share of earnings also comes from associate and joint-venture terminals, which means ports it does not fully own but from which it receives a share of profit. Based on the company’s reporting structure and recent annual disclosures, the revenue mix is broadly centered on terminal business, with activities concentrated in a few operating lines:
- Terminal operations and related services: about 100% of reported revenue. This includes loading and unloading containers, berth services, storage yards, and other port-related handling services.
- Mainland China terminals: the largest geographic earnings base, driven by domestic gateway ports and transshipment hubs connected to Chinese exports and imports.
- Overseas terminals: a smaller but strategically important part of the portfolio, giving the group access to trade corridors linked to the Belt and Road network and major east-west shipping lanes.
- Share of profits from associates and joint ventures: economically very important, even when not fully visible in top-line revenue, because many terminals are held through minority or shared ownership structures.
The business model is relatively straightforward: more containers moving through its ports generally support higher throughput and stronger operating leverage, while ownership stakes in a broad portfolio can soften the effect of weakness at any single location. Over the last several years, revenue has trended upward from roughly $1.2 billion in 2021 to about $1.67 billion in 2025, although the path has not been perfectly smooth. Costs have also risen, and interest expense remains meaningful, which is important when assessing how much of that growth reaches shareholders.
The long-term pattern shows a business that has expanded revenue and preserved solid net profitability, but with more pressure at the operating level than the headline profit line alone suggests. That matters because port operators are capital-intensive and need steady throughput, disciplined financing, and efficient assets to convert scale into durable returns.
Key Figures
| Metric | Value | Sector ⓘ |
|---|---|---|
| Date | Oct 17, 2026 | |
| Context | ||
| Sector | Industrials | |
| Industry | Marine Shipping | |
| Market Cap ⓘ | $3.22B | |
| Beta ⓘ | 1.05 | |
Value (Cheapness) | ||
| P/E Ratio ⓘ | 8.91 | 22.10 |
| P/B Ratio ⓘ | 0.48 | 1.97 |
| FCF Yield ⓘ | N/A | 6.38% |
| Dividend Yield ⓘ | 4.61% | 1.94% |
| EBIT / EV ⓘ | N/A | 4.79% |
| PEG ⓘ | 1.31 | |
Growth (Business expansion) | ||
| Revenue Growth ⓘ | 14.10% | 9.30% |
| RPS Growth (5Y CAGR) ⓘ | 4.59% | 7.81% |
| EPS Growth (5Y CAGR) ⓘ | -11.63% | -13.06% |
| BVPS Growth (5Y CAGR) ⓘ | -5.88% | 6.14% |
| Margin Growth (5Y Trend) ⓘ | -36.41% | 0.88% |
| FCF Growth (5Y CAGR) ⓘ | 87.88% | 11.01% |
| DPS Growth (5Y CAGR) ⓘ | -38.40% | 9.48% |
Quality (Business durability) | ||
| ROIC (Latest) ⓘ | N/A | 10.84% |
| ROA (Latest) ⓘ | 2.82% | 5.41% |
| ROIC (5Y Median) ⓘ | 3.33% | 9.38% |
| ROA (5Y Median) ⓘ | 2.63% | 4.95% |
| Net Debt / EBIT (Latest) ⓘ | N/A | 2.08 |
| Net Debt / EBIT (5Y Median) ⓘ | 4.82 | 2.27 |
| Net Debt / EBITDA (Latest) ⓘ | 10.01 | 1.39 |
| Net Debt / Assets ⓘ | 19.58% | 19.28% |
| EBITDA / Interest ⓘ | 1.55 | 9.58 |
| Operating Margin (Latest) ⓘ | N/A | 10.50% |
| Operating Margin (5Y Median) ⓘ | 40.34% | 10.29% |
| Debt to Equity (Latest) ⓘ | 57.57% | 65.48% |
| Profit Margin (Latest) ⓘ | 20.58% | 6.67% |
| Free Cash Flow (Latest) ⓘ | N/A | |
Momentum (Price trend) | ||
| 3Y Return ⓘ | +44.33% | +61.68% |
| 12M Return (excl. last month) ⓘ | -0.91% | +12.58% |
| 6M Return ⓘ | +3.43% | 0.00% |
| Price vs. 200-Day MA ⓘ | +40.42% | +0.02% |
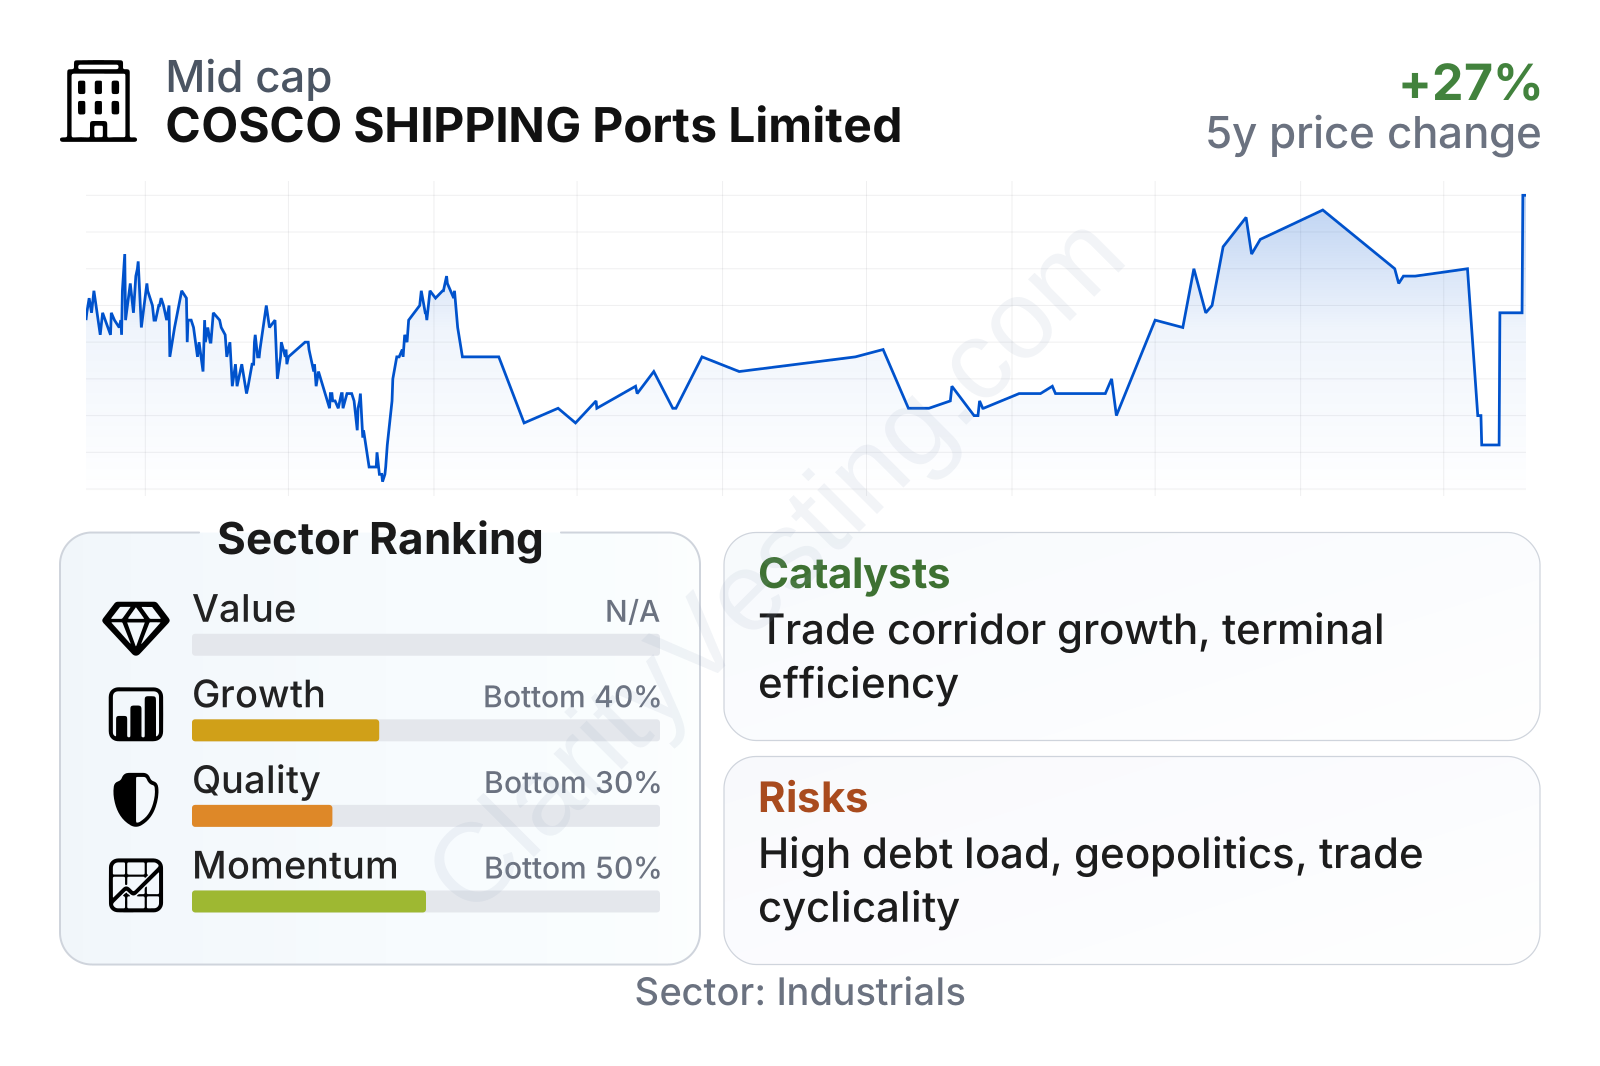
The overall profile is mixed. On valuation, COSCO SHIPPING Ports looks inexpensive relative to many industrial peers, with a price-to-earnings ratio below 10 and a price-to-book ratio well below the sector median. The dividend yield is also noticeably above the sector median. On growth, recent revenue growth has been better than the sector median, but the longer five-year picture is less impressive, which is why the company still ranks in the lower part of the sector on growth.
Quality is the weakest area in the scorecard. Profit margin is strong, but returns on assets are below the sector median, and leverage-related measures are stretched, especially net debt relative to EBITDA and interest coverage. Momentum is also unremarkable overall: the stock has recovered over several years, yet recent relative performance has been uneven compared with the broader sector.
Growth
The port sector is supported by a basic long-term trend: world trade still relies heavily on containerized shipping, and major ports remain essential infrastructure. Growth is rarely explosive in this industry, but demand can expand over time through higher trade volumes, larger ships, greater terminal automation, and the need for more efficient logistics corridors. For COSCO SHIPPING Ports, this creates a reasonable backdrop, especially because the company is positioned inside one of the world’s largest shipping ecosystems.
The strategy also makes industrial sense. The company is not just running a few isolated docks; it has built a network connected to major shipping routes and to the parent group’s liner operations. That linkage can help support throughput, asset utilization, and customer stickiness. The overseas portfolio is another important angle, because it gives exposure to trade routes beyond mainland China and may reduce reliance on any one local market over time.
Recent growth has improved after a softer period. Revenue growth turned negative around parts of 2023 and 2024, then moved back into positive territory in 2025, with year-over-year expansion in the high single digits to low teens. That suggests throughput and pricing conditions have stabilized rather than continuing to deteriorate. The five-year revenue trend is positive, but not strong enough on its own to place the company among the sector’s better growth names.
A meaningful catalyst is the continuing development of trade corridors tied to Chinese shipping and logistics networks. COSCO SHIPPING Ports can benefit when cargo flows are directed through terminals where it has operating control or ownership stakes. Another catalyst is operational improvement: if the company can lift throughput, automate more facilities, and control expenses better, even moderate revenue growth could translate into better cash generation. Free cash flow growth over the last five years has been very strong, which indicates there is room for improvement even without dramatic top-line acceleration.
Recent company updates have also emphasized terminal network development and efficiency initiatives, which fit the needs of a global port operator facing larger vessels, tighter turnaround expectations, and increasingly digital logistics systems. Those are not short-lived drivers; they support the long-duration nature of the business.
Risks
This article is for informational purposes only and does not constitute financial advice. Some content is AI-generated. See Disclaimer


