Stock Analysis · CoStar Group Inc (CSGP)
Overview
CoStar Group is a real estate information and online marketplace company. In simple terms, it gathers property data, analytics, images, tenant and lease information, and market research, then sells access to that information through subscriptions and advertising products. Its customers include commercial real estate brokers, landlords, lenders, investors, property managers, apartment owners, and, increasingly, residential home shoppers through its Homes.com platform.
The company has historically been strongest in commercial real estate, where its databases and software tools are used to research buildings, rents, vacancies, transactions, and potential tenants. Over time, CoStar expanded into adjacent categories including apartments, hospitality analytics, land listings, and residential portals. That mix matters because it gives the company recurring subscription revenue from professionals while also creating a larger consumer-facing growth opportunity.
Based on recent company reporting, CoStar’s main sources of revenue can be summarized as follows:
- Commercial property and marketplace subscriptions: approximately 70% to 75%. This includes CoStar’s flagship commercial real estate information services as well as LoopNet, which helps market properties for sale or lease.
- Apartments and rental-related services: approximately 10% to 15%. This is mainly Apartments.com and related rental marketing products used by multifamily property owners and managers.
- Hospitality, land, and other marketplaces/data products: approximately 10% to 15%. This includes hotel analytics through STR and other specialized property platforms.
- Residential portal revenue: currently a smaller but rising share. Homes.com has become strategically important, even if it still weighs on profits because of heavy marketing and product investment.
One notable operating trend is that revenue has continued to rise steadily, from roughly $1.9 billion in 2021 to about $3.2 billion in 2025, while profitability has fallen sharply because spending increased much faster than sales. Research, product development, and selling costs have all climbed, reflecting the push into newer growth areas, especially residential.
The business still converts a large share of revenue into gross profit, which reflects the economics of software, data, and digital marketplaces. The recent pressure has come lower down the income statement, where aggressive investment has compressed operating income and left net income near break-even in 2025.
Key Figures
| Metric | Value | Sector ⓘ |
|---|---|---|
| Date | Oct 24, 2026 | |
| Context | ||
| Sector | Real Estate | |
| Industry | Real Estate Services | |
| Market Cap ⓘ | $13.33B | |
| Beta ⓘ | 0.80 | |
Value (Cheapness) | ||
| P/E Ratio ⓘ | 182.78 | 17.85 |
| P/B Ratio ⓘ | 1.81 | 0.87 |
| FCF Yield ⓘ | 2.34% | 7.30% |
| Dividend Yield ⓘ | N/A | 4.83% |
| EBIT / EV ⓘ | 0.87% | 3.78% |
| PEG ⓘ | 0.11 | |
Growth (Business expansion) | ||
| Revenue Growth ⓘ | 18.40% | 5.35% |
| RPS Growth (5Y CAGR) ⓘ | 11.84% | 6.02% |
| EPS Growth (5Y CAGR) ⓘ | -22.86% | -10.65% |
| BVPS Growth (5Y CAGR) ⓘ | 8.01% | 0.43% |
| Margin Growth (5Y Trend) ⓘ | -21.48% | -0.69% |
| FCF Growth (5Y CAGR) ⓘ | -43.58% | 5.40% |
| DPS Growth (5Y CAGR) ⓘ | N/A | 5.07% |
Quality (Business durability) | ||
| ROIC (Latest) ⓘ | 0.78% | 5.69% |
| ROE (Latest) ⓘ | 0.90% | 7.37% |
| ROA (Latest) ⓘ | 0.71% | 2.85% |
| ROIC (5Y Median) ⓘ | 8.55% | 4.26% |
| ROE (5Y Median) ⓘ | 5.27% | 6.04% |
| ROA (5Y Median) ⓘ | 4.13% | 2.45% |
| Net Debt / EBIT (Latest) ⓘ | -1.12 | 7.55 |
| Net Debt / EBIT (5Y Median) ⓘ | -7.94 | 8.26 |
| Net Debt / EBITDA (Latest) ⓘ | -0.27 | 5.26 |
| Net Debt / Assets ⓘ | -1.09% | 37.45% |
| EBITDA / Interest ⓘ | 29.10 | 4.11 |
| Operating Margin (Latest) ⓘ | 2.79% | 33.86% |
| Operating Margin (5Y Median) ⓘ | 21.70% | 37.49% |
| Debt to Equity (Latest) ⓘ | 14.56% | 88.76% |
| Profit Margin (Latest) ⓘ | 2.08% | 18.94% |
| Free Cash Flow (Latest) ⓘ | $312.00M | |
Momentum (Price trend) | ||
| 3Y Return ⓘ | -51.60% | +36.33% |
| 12M Return (excl. last month) ⓘ | -66.67% | +4.32% |
| 6M Return ⓘ | -8.56% | -1.74% |
| Price vs. 200-Day MA ⓘ | -5.66% | -1.42% |
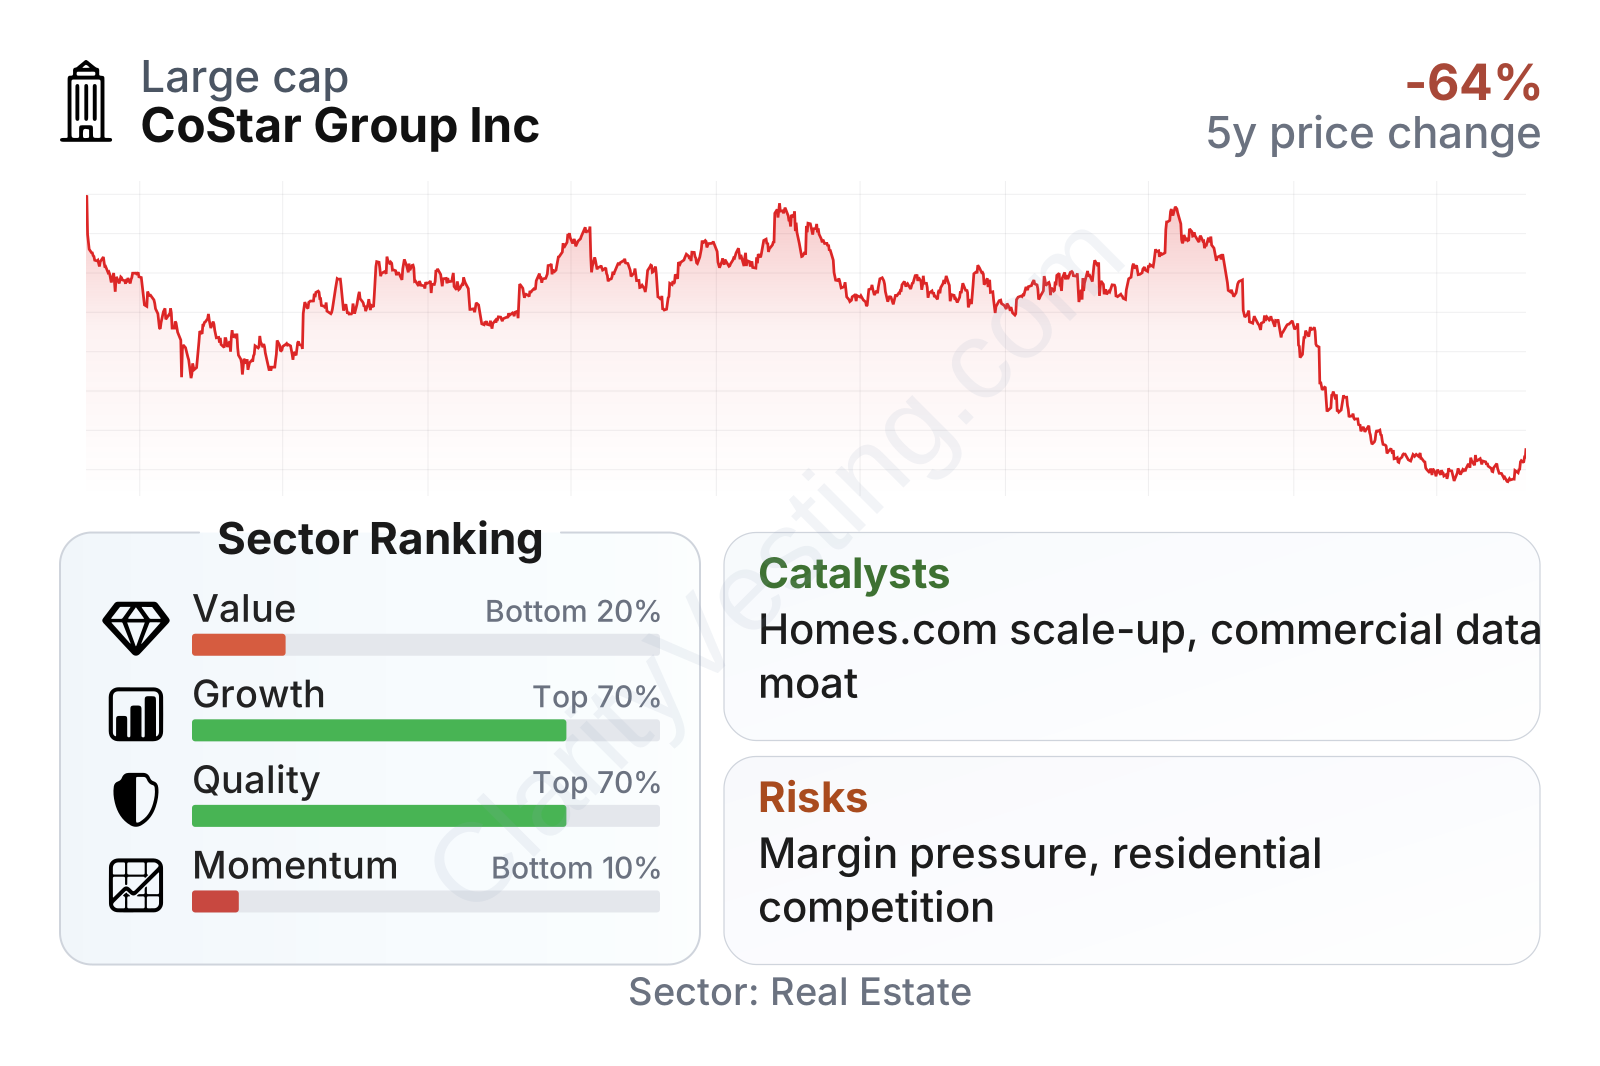
CoStar currently looks mixed on fundamentals. Growth remains better than much of the real estate services sector, with revenue increasing at a high-teens yearly pace and revenue per share compounding at a solid double-digit rate over five years. Balance sheet strength is also clear, with low leverage and net cash. The weak areas are current profitability, returns on capital, and market performance. Valuation metrics also remain demanding compared with the sector, even after a major drop in the share price.
The stock chart shows how sharply sentiment has changed. After trading at much higher levels in earlier years, the shares fell heavily through 2026. That decline reflects concern about margin pressure and the time it may take for recent investments to generate stronger earnings rather than a collapse in revenue.
Growth
CoStar operates in attractive niches of real estate technology and digital marketplaces. Commercial real estate data is a specialized field where customers need reliable and constantly updated information, and apartment advertising continues shifting toward online platforms. Residential home search is also a very large market, which explains why the company is investing so heavily in Homes.com.
The company’s strategy makes sense from a long-term business-building perspective. It already owns strong brands in commercial listings and rental advertising, and it has the financial resources to fund expansion without relying heavily on debt. The idea is straightforward: use a dominant information business to finance broader marketplace businesses that can attract both professionals and consumers.
Revenue per share has moved consistently higher over the last five years, which suggests the core business has continued to expand even while earnings have become less predictable. That is an important distinction for long-term analysis: the top line is still advancing, but management is choosing to reinvest heavily rather than maximize near-term profit.
A major catalyst is Homes.com. CoStar has been building it into a national residential platform with high marketing visibility and a model designed around agents and listings. If that platform gains durable consumer traffic and monetization improves, it could meaningfully enlarge CoStar’s addressable market beyond its traditional commercial niche.
Another support for future growth is the company’s history of acquisitions and product expansion. CoStar has repeatedly used data, software, and network effects to move into related property categories. That approach can work well when a company already has deep industry relationships and a reputation for comprehensive information.
There is effectively no dividend profile to support the long-term case. CoStar is primarily a reinvestment-driven company, and the focus remains on expansion rather than returning capital through regular payouts.
Recent corporate developments have continued to center on residential expansion, product investment, and the effort to convert audience growth into revenue at Homes.com. For a company of CoStar’s size, success there would be more meaningful than a routine incremental improvement in the legacy business.
Risks
This article is for informational purposes only and does not constitute financial advice. Some content is AI-generated. See Disclaimer


