Stock Analysis · CorVel Corp (CRVL)
Overview
CorVel Corp is a specialized service company focused on workers’ compensation, disability, and related healthcare cost management. In simple terms, it helps employers, insurance carriers, and government agencies handle workplace injury claims, manage medical treatment, and control the overall cost of those claims. Its platform combines claims administration, medical bill review, case management, pharmacy services, and network solutions.
The business is built around recurring activity rather than one-time projects. When an injured worker files a claim, CorVel can be involved in multiple steps of the process, from the first report of injury to medical management and payment review. That creates a service model tied to claim volume, customer retention, and the company’s ability to route more work through its own technology-enabled workflow.
Based on the company’s latest annual filing for fiscal 2026, revenue is primarily generated from two broad segments.
- Patient Management revenue: about 82% of total revenue. This is the largest part of the business and includes workers’ compensation care management, claims management, case management, directed care, pharmacy management, and related services tied to handling and overseeing claims.
- Network Solutions revenue: about 18% of total revenue. This segment includes medical bill review, preferred provider organization access, and other network-related services used to reduce and validate medical costs.
Over the last several years, total revenue, gross profit, operating income, and net income have all moved higher, which points to a business expanding without heavy balance-sheet strain. The main visible trend is that profit has grown faster than revenue, suggesting operating leverage and improved execution as volume scales.
Key Figures
| Metric | Value | Sector ⓘ |
|---|---|---|
| Date | Oct 24, 2026 | |
| Context | ||
| Sector | Financial Services | |
| Industry | Insurance Brokers | |
| Market Cap ⓘ | $4.08B | |
| Beta ⓘ | 1.05 | |
Value (Cheapness) | ||
| P/E Ratio ⓘ | 36.36 | 12.46 |
| P/B Ratio ⓘ | 10.45 | 1.25 |
| FCF Yield ⓘ | 2.79% | 9.82% |
| Dividend Yield ⓘ | N/A | 2.94% |
| EBIT / EV ⓘ | 4.35% | 8.11% |
| PEG ⓘ | N/A | |
Growth (Business expansion) | ||
| Revenue Growth ⓘ | 10.70% | 9.10% |
| RPS Growth (5Y CAGR) ⓘ | 11.80% | 12.31% |
| EPS Growth (5Y CAGR) ⓘ | -40.01% | -6.97% |
| BVPS Growth (5Y CAGR) ⓘ | 18.25% | 5.02% |
| Margin Growth (5Y Trend) ⓘ | 1.85% | -4.00% |
| FCF Growth (5Y CAGR) ⓘ | 31.04% | 4.71% |
| DPS Growth (5Y CAGR) ⓘ | N/A | 8.92% |
Quality (Business durability) | ||
| ROIC (Latest) ⓘ | 29.93% | 9.18% |
| ROE (Latest) ⓘ | 29.89% | 13.93% |
| ROA (Latest) ⓘ | 17.72% | 1.57% |
| ROIC (5Y Median) ⓘ | 32.02% | 7.80% |
| ROE (5Y Median) ⓘ | 32.02% | 12.15% |
| ROA (5Y Median) ⓘ | 17.97% | 1.28% |
| Net Debt / EBIT (Latest) ⓘ | -1.50 | 1.02 |
| Net Debt / EBIT (5Y Median) ⓘ | -0.78 | 0.72 |
| Net Debt / EBITDA (Latest) ⓘ | -1.24 | 0.88 |
| Operating Margin (Latest) ⓘ | 15.37% | 22.30% |
| Operating Margin (5Y Median) ⓘ | 13.08% | 24.50% |
| Debt to Equity (Latest) ⓘ | 6.94% | 59.34% |
| Profit Margin (Latest) ⓘ | 11.72% | 26.42% |
| Free Cash Flow (Latest) ⓘ | $113.82M | |
Momentum (Price trend) | ||
| 3Y Return ⓘ | +28.29% | +95.73% |
| 12M Return (excl. last month) ⓘ | -7.42% | +17.30% |
| 6M Return ⓘ | +46.13% | +6.07% |
| Price vs. 200-Day MA ⓘ | +35.09% | +5.36% |
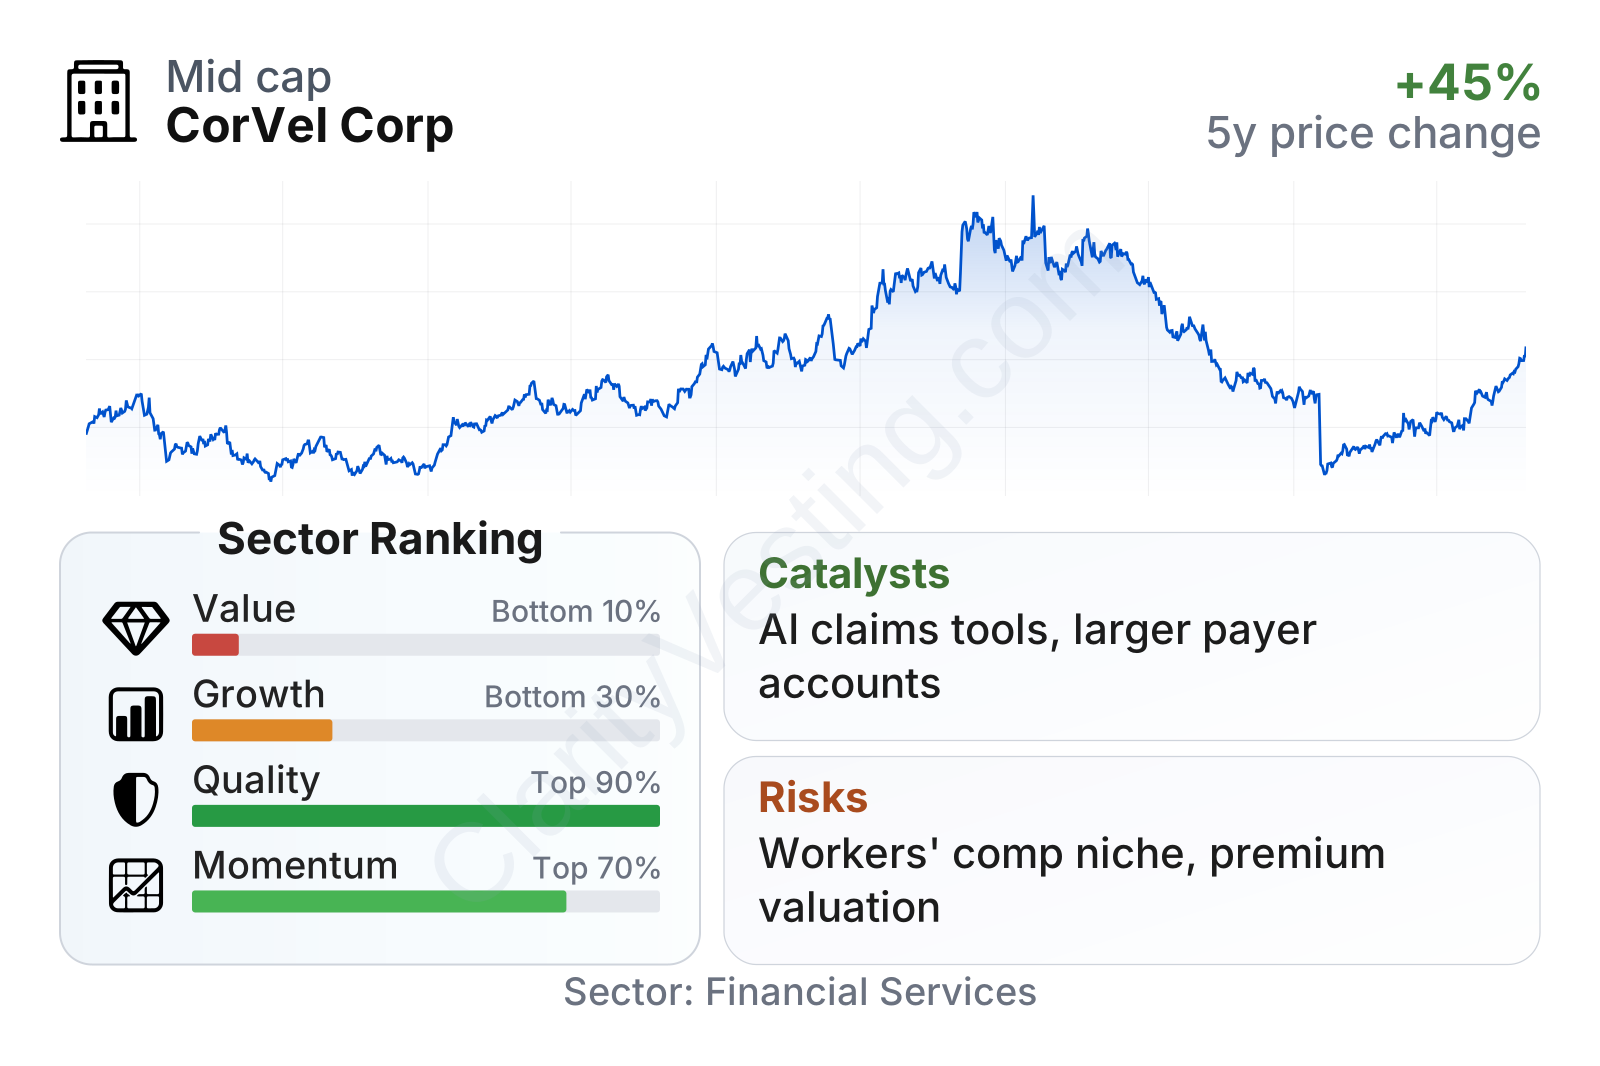
CorVel stands out more for business quality than for cheap valuation. Profitability metrics are well above most companies in its sector, with returns on capital, equity, and assets all unusually strong. The balance sheet is also conservative, with low leverage and net cash rather than net debt. Growth is mixed: revenue has remained healthy, book value has compounded well, and free cash flow has grown strongly, but earnings per share over the measured five-year period look distorted by capital allocation and share-count changes. Market performance has also been uneven, with a strong rebound in recent months after a much weaker stretch over the prior year.
Growth
CorVel operates in a part of the healthcare and insurance ecosystem that is likely to remain relevant for a long time. Employers and insurers continue to look for lower claim costs, faster resolution, and better visibility into medical spending. That creates steady demand for outsourced claims administration, bill review, provider networks, and care management. This is not a hypergrowth industry, but it is a durable one, supported by ongoing workplace injury claims and the need to manage medical inflation.
The company’s strategy appears consistent with that backdrop. CorVel has spent years building an integrated platform that ties together claims management and medical cost controls. That matters because customers often prefer fewer vendors, smoother workflows, and better data across the life of a claim. If CorVel can keep deepening customer relationships and shifting activity onto its technology platform, it can potentially grow both volume and efficiency at the same time.
A notable recent growth driver is the company’s continued emphasis on artificial intelligence tools, workflow automation, and its cloud-based claims platform. Management has highlighted investments in products such as intelligent document handling, clinical support tools, and digital claim intake. In practical terms, these tools can help process claims faster, reduce manual work, and make CorVel more attractive to insurers and self-insured employers that want a modern claims process.
Recent operating results support the broader growth case. Fiscal 2026 revenue rose to roughly $959 million from about $896 million in fiscal 2025, while net income increased to about $110 million from roughly $95 million. That combination suggests the company is still adding business while preserving margins well enough to convert growth into higher earnings.
The earnings trend deserves some nuance. Annual earnings per share improved from fiscal 2022 through fiscal 2024, then became more uneven afterward. That soft patch does not fully match the company’s rising net income, which means readers should pay attention to share-count effects, stock-based compensation, and period-to-period comparability rather than viewing the EPS line in isolation. Even so, the long-term business direction still looks positive because revenue, operating profit, and cash generation have all advanced.
Book value per share has climbed sharply over the last several years, which is another encouraging sign. In a service business with limited financial leverage, rising book value often indicates that profits are being retained and converted into a stronger equity base. CorVel’s pace here has been much better than the sector median, reinforcing the idea that value creation has been real even if the earnings-per-share pattern looks noisier.
As for catalysts, the clearest ones are continued migration toward technology-led claims administration, wider adoption of automated medical bill review, and any expansion in large employer or carrier accounts. Another potential tailwind is medical cost pressure itself: when healthcare costs rise, customers often become more motivated to outsource claim management and cost containment to specialized providers.
Risks
This article is for informational purposes only and does not constitute financial advice. Some content is AI-generated. See Disclaimer


