Stock Analysis · China Resources Power Holding (CRPJY)
Overview
China Resources Power Holding is a large Chinese power producer and utility operator. The company develops, owns, and operates electricity generation assets and also sells electricity and heat. Its portfolio has historically been centered on coal-fired power, but in recent years it has been expanding into wind and solar at a faster pace. That makes it a traditional power company that is gradually repositioning toward cleaner generation rather than a pure renewable operator.
The business model is fairly simple: build or acquire power plants, generate electricity, sell that electricity into the grid, and earn returns based on utilization, tariffs, fuel costs, and project efficiency. Profitability can improve meaningfully when coal prices ease, when renewable capacity rises, or when newly built projects begin contributing.
Main revenue sources are led by electricity sales from thermal generation, followed by renewable generation and then smaller contributions such as heat supply and other operating activities. Based on the company’s recent annual disclosures and operating mix, the revenue structure is best understood as approximate ranges rather than exact fixed shares because reported segment presentation can vary by period.
- Coal-fired power generation: approximately 70% to 80% of revenue. This is the largest business and includes electricity sold from thermal plants, which remain important for baseload supply.
- Wind and solar power generation: approximately 15% to 25% of revenue. This includes electricity from renewable projects and is the company’s main expansion area.
- Heat supply, coal-related and other operating income: approximately 5% to 10% of revenue. These activities are smaller but support the broader utility platform.
What stands out in the business profile is the combination of scale, strong ties to China’s domestic power market, and a visible transition path toward lower-carbon assets. The company is not the most diversified utility globally, but it is deeply embedded in one of the world’s largest electricity systems.
The profit structure has improved materially over the last several years. Revenue has stayed around a similar level, but costs of revenue have fallen sharply from the 2022 peak, which lifted gross profit and net income. In plain terms, the company has recently earned more from each unit of revenue, helped by better fuel economics and operating leverage.
Key Figures
| Metric | Value | Sector ⓘ |
|---|---|---|
| Date | Oct 03, 2026 | |
| Context | ||
| Sector | Utilities | |
| Industry | Utilities - Independent Power Producers | |
| Market Cap ⓘ | $12.32B | |
| Beta ⓘ | 0.63 | |
Value (Cheapness) | ||
| P/E Ratio ⓘ | 7.28 | 16.80 |
| P/B Ratio ⓘ | 0.10 | 1.48 |
| FCF Yield ⓘ | -153.83% | 0.64% |
| Dividend Yield ⓘ | 5.86% | 3.91% |
| EBIT / EV ⓘ | N/A | 5.01% |
| PEG ⓘ | 1.90 | |
Growth (Business expansion) | ||
| Revenue Growth ⓘ | 9.40% | 6.00% |
| RPS Growth (5Y CAGR) ⓘ | 1.14% | 4.14% |
| EPS Growth (5Y CAGR) ⓘ | 48.03% | -11.39% |
| BVPS Growth (5Y CAGR) ⓘ | 1.05% | 4.29% |
| Margin Growth (5Y Trend) ⓘ | 13.82% | 3.55% |
| FCF Growth (5Y CAGR) ⓘ | -28.76% | -9.10% |
| DPS Growth (5Y CAGR) ⓘ | 12.37% | 4.51% |
Quality (Business durability) | ||
| ROIC (Latest) ⓘ | N/A | 6.53% |
| ROA (Latest) ⓘ | 6.51% | 3.19% |
| ROIC (5Y Median) ⓘ | 5.85% | 6.12% |
| ROA (5Y Median) ⓘ | 3.63% | 2.76% |
| Net Debt / EBIT (Latest) ⓘ | 5.11 | 7.15 |
| Net Debt / EBIT (5Y Median) ⓘ | 9.21 | 7.24 |
| Net Debt / EBITDA (Latest) ⓘ | 2.68 | 4.40 |
| Net Debt / Assets ⓘ | 45.94% | 39.16% |
| EBITDA / Interest ⓘ | 10.21 | 4.41 |
| Operating Margin (Latest) ⓘ | 19.30% | 20.93% |
| Operating Margin (5Y Median) ⓘ | 19.03% | 20.18% |
| Debt to Equity (Latest) ⓘ | 198.35% | 140.88% |
| Profit Margin (Latest) ⓘ | 12.46% | 11.32% |
| Free Cash Flow (Latest) ⓘ | -$18.95B | |
Momentum (Price trend) | ||
| 3Y Return ⓘ | +49.09% | +48.75% |
| 12M Return (excl. last month) ⓘ | -1.18% | +11.24% |
| 6M Return ⓘ | +0.44% | -3.69% |
| Price vs. 200-Day MA ⓘ | +16.24% | -1.97% |
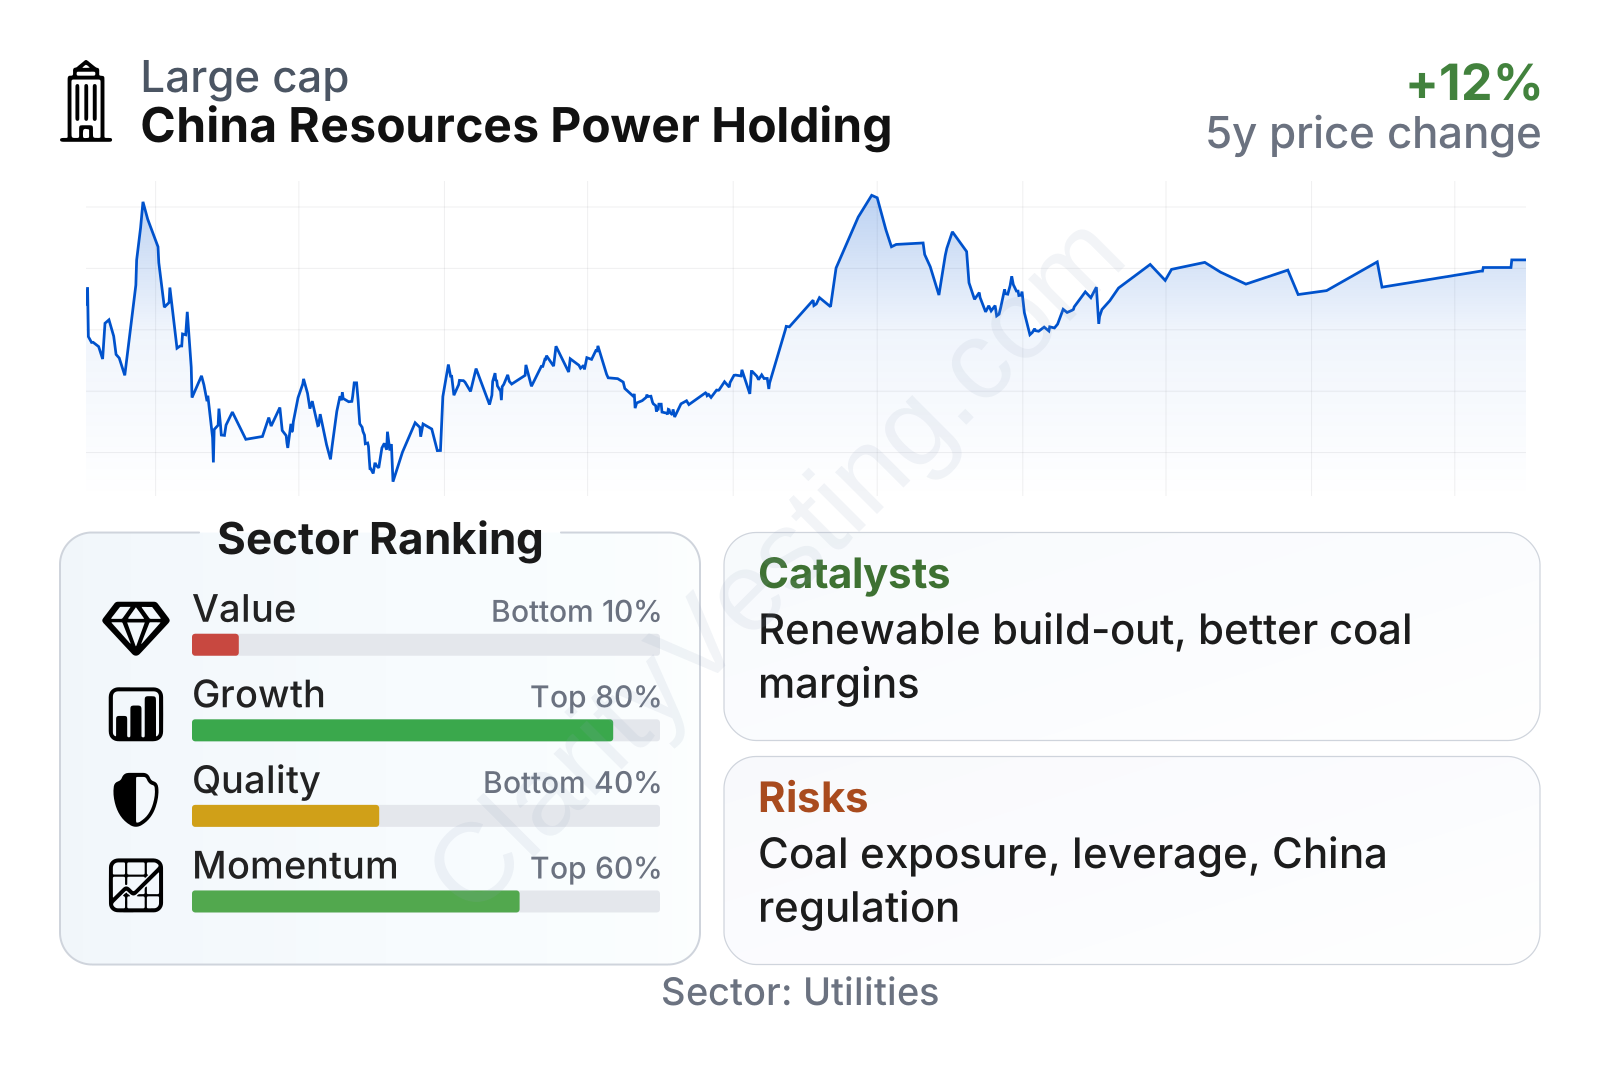
China Resources Power is a large utility by market value, with relatively low share-price volatility for an equity. On valuation, the stock screens cheaply against the sector on earnings and especially on book value, while the dividend yield is above the sector median. Growth indicators are mixed but not weak: recent revenue growth has been ahead of the sector median, and earnings growth over the last five years has been strong. Quality is more uneven, with solid asset returns and interest coverage, but leverage remains heavier than the sector norm. Momentum is moderate rather than strong, with long-term performance holding up better than short-term price action.
Growth
The company operates in a sector with long-term structural relevance. Electricity demand in China is still supported by urbanization, industrial activity, electrification, data infrastructure, and transport electrification. At the same time, the power mix is changing. That matters because companies able to add renewable capacity while keeping their conventional fleet productive can continue growing even in a highly regulated industry.
China Resources Power’s strategy appears logical in that context. It still benefits from its existing thermal base, which provides scale and system importance, but it is also investing into wind and solar projects that should gradually improve the business mix. Renewable assets often come with lower operating costs once built, while thermal plants remain exposed to fuel-price swings. Over time, that shift can make earnings more resilient.
Revenue per share has been broadly stable over the last few years, with modest growth followed by some recent softness. That suggests the expansion case is not mainly about rapid top-line acceleration. Instead, the more important driver has been better profitability, project mix, and operating efficiency. For a utility, that can still be meaningful if earnings and cash generation improve faster than revenue.
Free cash flow is a more complicated part of the picture. Recent readings have been weak, which is often the tradeoff when a utility is spending heavily on new capacity. For a company expanding in renewables and maintaining a large legacy fleet, temporary pressure on free cash flow is not unusual. The key question is whether those investments produce durable returns through higher future output, better margins, and a more modern asset base.
A practical catalyst is the ongoing build-out of wind and solar capacity in China. If the company continues to commission projects at scale, renewable generation should become a larger share of earnings over time. Another catalyst is fuel-cost normalization: when coal prices are less extreme, thermal profitability can recover quickly. Combined with continued electricity demand growth, that gives the company more than one route to earnings expansion.
Recent company communications have continued to emphasize renewable development and portfolio optimization. That is significant because the market often assigns different valuation expectations to utilities that are simply defending existing assets versus those that are actively reshaping their generation mix.
Risks
This article is for informational purposes only and does not constitute financial advice. Some content is AI-generated. See Disclaimer


