Stock Analysis · China Resources Power Holdings Company Limited (CRPJF)
Overview
China Resources Power Holdings Company Limited is a large Chinese power producer and energy operator. It develops, invests in, owns, and operates electricity generation assets across China. The company has historically been known for coal-fired power, but it has been expanding its portfolio in wind, solar, hydropower, and other cleaner energy projects. It also has activities linked to power sales, heat supply in some areas, and value-chain services tied to its generation assets.
For long-term analysis, the key point is that this is not a narrow single-plant operator. It is a diversified utility-scale electricity company with a mix of conventional and renewable generation, backed by one of China’s major state-owned enterprise groups, China Resources. That matters because power generation is capital intensive, tightly regulated, and often influenced by access to financing, project approvals, and grid relationships.
The company’s revenue mainly comes from selling electricity generated by its plants. Based on recent annual disclosures and the group’s business structure, the broad revenue mix can be summarized as follows:
- Thermal power generation: approximately 70% to 80% of revenue. This includes mainly coal-fired electricity sold to the grid and remains the largest earnings engine, even as the generation mix shifts.
- Renewable energy generation: approximately 15% to 25% of revenue. This includes wind and solar projects, with some hydro and other clean-energy assets depending on the year and project mix.
- Other operations: approximately 5% to 10% of revenue. This can include heat supply, service income, and other ancillary business lines linked to energy operations.
The business mix is important because thermal power still provides scale and cash generation, while renewables are where much of the long-term policy support and capacity growth in China are concentrated.
The profit flow over recent years shows a notable improvement in cost control and margins. Revenue has stayed around the same broad level since 2022, but gross profit and net income moved up strongly through 2024 and remained high in 2025. That suggests the earnings recovery came less from rapid top-line expansion and more from a better fuel-cost environment, a more favorable operating mix, and stronger profitability per unit of revenue.
Key Figures
| Metric | Value | Sector ⓘ |
|---|---|---|
| Date | Oct 17, 2026 | |
| Context | ||
| Sector | Utilities | |
| Industry | Utilities - Independent Power Producers | |
| Market Cap ⓘ | $10.30B | |
| Beta ⓘ | 0.67 | |
Value (Cheapness) | ||
| P/E Ratio ⓘ | 5.53 | 17.28 |
| P/B Ratio ⓘ | 0.10 | 1.51 |
| FCF Yield ⓘ | -183.78% | 0.65% |
| Dividend Yield ⓘ | 46.87% | 3.77% |
| EBIT / EV ⓘ | N/A | 5.01% |
| PEG ⓘ | 1.95 | |
Growth (Business expansion) | ||
| Revenue Growth ⓘ | 9.40% | 6.10% |
| RPS Growth (5Y CAGR) ⓘ | 1.18% | 3.87% |
| EPS Growth (5Y CAGR) ⓘ | -19.55% | -11.30% |
| BVPS Growth (5Y CAGR) ⓘ | -1.66% | 4.23% |
| Margin Growth (5Y Trend) ⓘ | 13.82% | 3.57% |
| FCF Growth (5Y CAGR) ⓘ | -25.45% | -8.84% |
| DPS Growth (5Y CAGR) ⓘ | 12.41% | 4.84% |
Quality (Business durability) | ||
| ROIC (Latest) ⓘ | N/A | 6.53% |
| ROA (Latest) ⓘ | 6.59% | 3.20% |
| ROIC (5Y Median) ⓘ | 5.41% | 5.95% |
| ROA (5Y Median) ⓘ | 3.63% | 2.75% |
| Net Debt / EBIT (Latest) ⓘ | 4.91 | 7.13 |
| Net Debt / EBIT (5Y Median) ⓘ | 9.95 | 7.23 |
| Net Debt / EBITDA (Latest) ⓘ | 2.62 | 4.31 |
| Net Debt / Assets ⓘ | 45.94% | 38.42% |
| EBITDA / Interest ⓘ | 10.43 | 4.58 |
| Operating Margin (Latest) ⓘ | 20.09% | 20.83% |
| Operating Margin (5Y Median) ⓘ | 19.03% | 20.08% |
| Debt to Equity (Latest) ⓘ | 198.35% | 137.69% |
| Profit Margin (Latest) ⓘ | 12.46% | 11.37% |
| Free Cash Flow (Latest) ⓘ | -$18.93B | |
Momentum (Price trend) | ||
| 3Y Return ⓘ | +62.85% | +52.37% |
| 12M Return (excl. last month) ⓘ | +15.36% | +8.84% |
| 6M Return ⓘ | +15.36% | -3.95% |
| Price vs. 200-Day MA ⓘ | +41.44% | -0.79% |
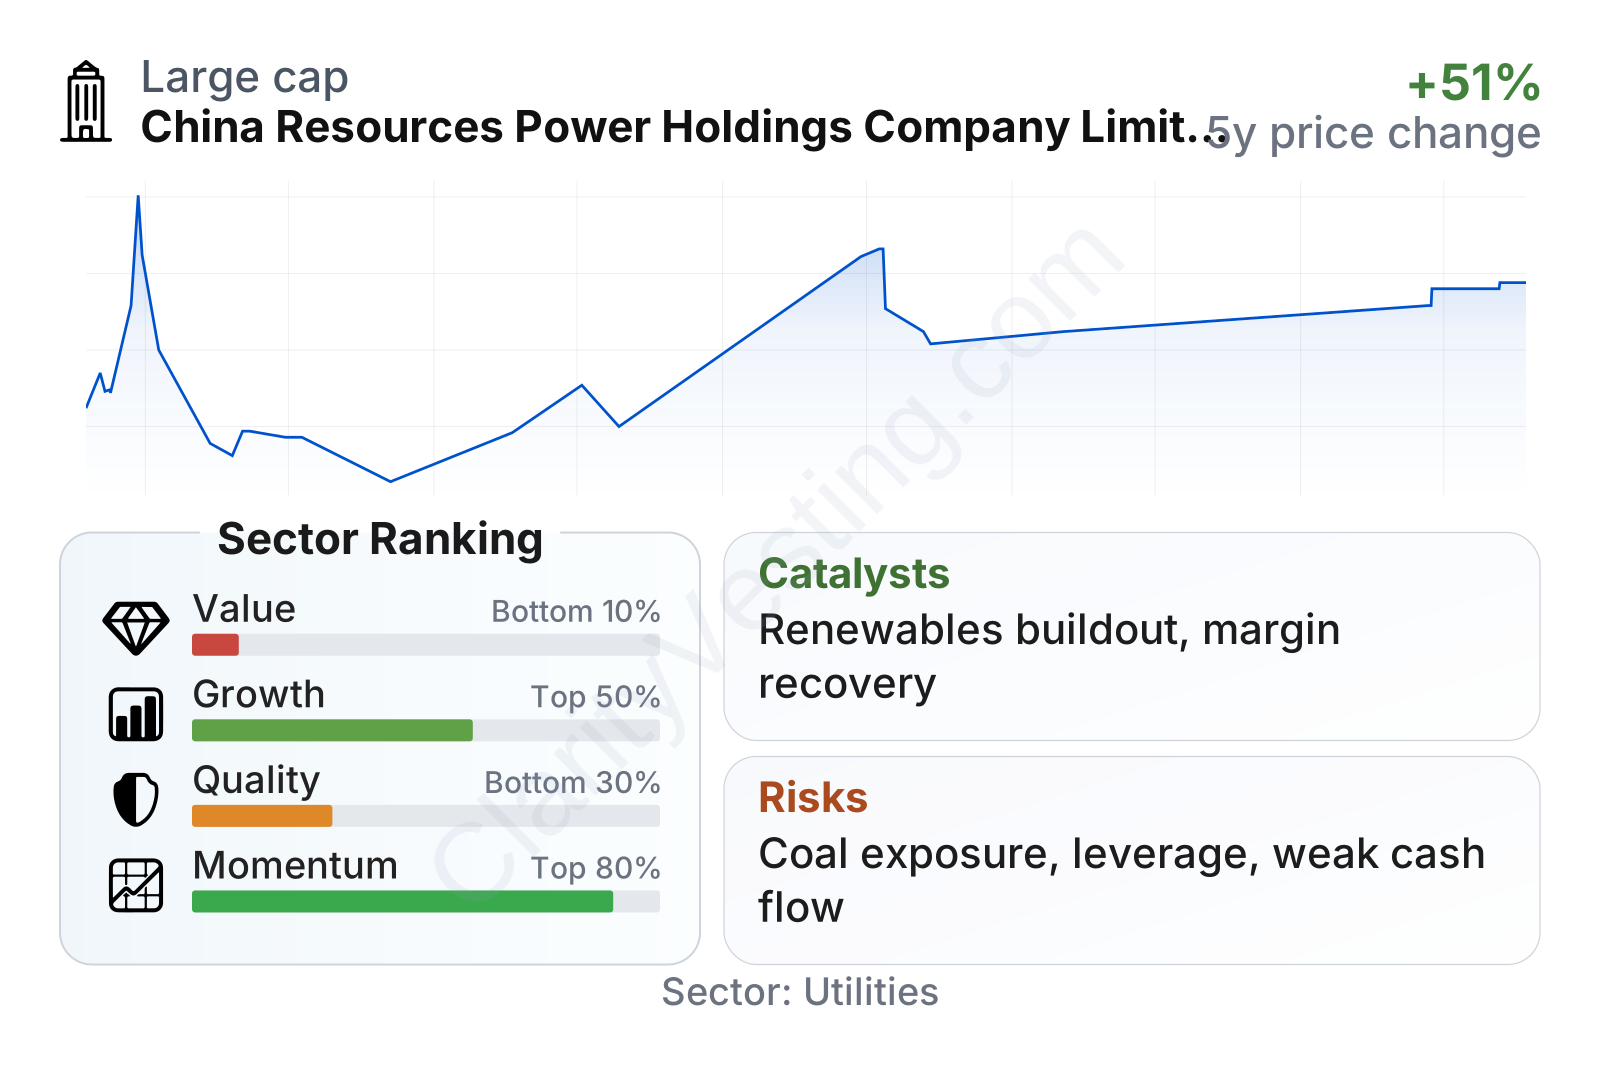
China Resources Power is a large utility by market value, with a relatively low beta of about 0.63, which points to lower share-price volatility than the broader market. The valuation multiples look unusually low versus the utility peer group, with earnings and book-value ratios far below sector medians. At the same time, that cheap appearance is not clean-cut: free cash flow is currently negative, leverage is above the sector median on a debt-to-equity basis, and the company’s quality ranking sits in the lower part of the sector despite decent profitability.
The picture is therefore mixed but understandable for a capital-heavy power producer. Profit margin is slightly above the sector median, interest coverage is strong, and recent share-price momentum has been better than much of the sector. However, weaker long-term earnings growth and negative recent free cash flow keep the metrics from looking straightforwardly strong across all categories.
Growth
China’s power sector remains a growth market in physical demand terms, even though it is no longer a simple volume-growth story. Electricity consumption continues to rise as industry upgrades, electric vehicles expand, data-center demand grows, and more parts of the economy become electrified. At the same time, China is pushing hard on renewable buildout and grid modernization. That gives established operators with access to capital, land, permits, and grid connections a clearer runway than many utilities in mature markets.
China Resources Power’s strategy broadly matches that direction. The company still benefits from its thermal fleet, which provides scale and dispatchable power, but its long-term relevance depends increasingly on adding wind and solar capacity while improving the economics of the existing fleet. That strategy makes industrial sense: coal remains important for grid reliability in China, but the growth pipeline is much stronger in renewables and integrated energy development.
The company also appears positioned to benefit from its parent group relationship and from its role as an established operator in regulated infrastructure. Large renewable projects in China often reward execution scale rather than pure technological novelty. In that kind of market, a company with financing access, government relationships, and operating experience can retain an edge.
Revenue per share has been relatively stable over the last five years rather than strongly compounding. There was a step-up from 2021 to 2022, followed by a mostly flat period and then some softening in 2025. That means the growth case is not based on rapid sales expansion. Instead, it rests more on capacity additions, a cleaner generation mix, and the possibility of sustaining improved margins as the portfolio evolves.
One positive sign is that recent year-over-year revenue growth has outpaced the sector median, and the company’s operating-margin trend over five years has improved more than the sector median. Dividend growth has also been strong over that period. Put together, that suggests the business has recently become more efficient and more shareholder-distributive even though long-term per-share growth remains modest.
A meaningful catalyst is the continued expansion of China’s renewable power system and the policy need for major utilities to build it out. Another is the possibility that better coal pricing and a rising share of renewables can keep earnings stronger than the market may have expected a few years ago. In a business where market sentiment often focuses on old coal exposure, any continued shift toward higher-quality earnings from cleaner assets could matter.
Risks
This article is for informational purposes only and does not constitute financial advice. Some content is AI-generated. See Disclaimer


