Stock Analysis · Crescent Energy Co (CRGY)
Overview
Crescent Energy Co is an independent U.S. oil and gas producer. In simple terms, it buys, develops, and operates energy properties that produce crude oil, natural gas, and natural gas liquids. Its assets are spread across several major producing regions in the United States, and its business model combines operating wells directly with owning non-operated interests alongside other producers. That mix matters because it can give the company exposure to production growth without having to fund every project itself.
The company’s revenue mainly comes from selling the hydrocarbons it produces. Based on its recent annual mix, the largest source is typically oil, followed by natural gas liquids and then natural gas. Exact percentages can move with commodity prices and production volumes, but a reasonable recent approximation is:
- Crude oil: about 55% to 65% of revenue. This is the main earnings driver and usually carries the highest value per barrel.
- Natural gas liquids: about 20% to 30% of revenue. This includes products such as propane, butane, and ethane.
- Natural gas: about 10% to 20% of revenue. This tends to be the smallest of the three major streams for Crescent.
Geographically, Crescent has built a diversified upstream portfolio rather than relying on one basin alone. That helps reduce field-level risk, but it does not remove the company’s dependence on oil and gas prices, which remain the biggest factor behind revenue and cash flow swings.
The recent financial flow also shows a business that can generate large gross profit but sees a meaningful amount absorbed by operating costs, overhead, and especially interest expense. That is a key theme for Crescent: the asset base is sizable, but debt and cost structure have a strong influence on what ultimately reaches net income.
Over the last few years, revenue has remained large in absolute terms, but the share turning into bottom-line profit has been uneven. Interest costs have climbed noticeably, which helps explain why strong production and sales do not always translate into equally strong net earnings.
Key Figures
| Metric | Value | Sector ⓘ |
|---|---|---|
| Date | Nov 06, 2026 | |
| Context | ||
| Sector | Energy | |
| Industry | Oil & Gas E&P | |
| Market Cap ⓘ | $4.38B | |
| Beta ⓘ | 0.91 | |
Value (Cheapness) | ||
| P/E Ratio ⓘ | 74.27 | 14.07 |
| P/B Ratio ⓘ | 0.72 | 1.62 |
| FCF Yield ⓘ | 21.44% | 9.12% |
| Dividend Yield ⓘ | 4.09% | 3.36% |
| EBIT / EV ⓘ | 1.91% | 7.97% |
| PEG ⓘ | N/A | |
Growth (Business expansion) | ||
| Revenue Growth ⓘ | 55.90% | 26.50% |
| RPS Growth (5Y CAGR) ⓘ | 13.79% | 6.70% |
| EPS Growth (5Y CAGR) ⓘ | -33.81% | -11.53% |
| BVPS Growth (5Y CAGR) ⓘ | 51.86% | 5.85% |
| Margin Growth (5Y Trend) ⓘ | 39.82% | 0.58% |
| FCF Growth (5Y CAGR) ⓘ | N/A | 3.35% |
| DPS Growth (5Y CAGR) ⓘ | 22.52% | 16.67% |
Quality (Business durability) | ||
| ROIC (Latest) ⓘ | 2.29% | 11.66% |
| ROA (Latest) ⓘ | 0.51% | 6.18% |
| ROIC (5Y Median) ⓘ | 4.92% | 10.30% |
| ROA (5Y Median) ⓘ | 1.05% | 5.45% |
| Net Debt / EBIT (Latest) ⓘ | 25.84 | 1.59 |
| Net Debt / EBIT (5Y Median) ⓘ | 7.49 | 1.82 |
| Net Debt / EBITDA (Latest) ⓘ | 3.03 | 0.98 |
| Net Debt / Assets ⓘ | 40.11% | 16.11% |
| EBITDA / Interest ⓘ | 4.14 | 9.78 |
| Operating Margin (Latest) ⓘ | 3.81% | 16.20% |
| Operating Margin (5Y Median) ⓘ | 13.97% | 20.39% |
| Debt to Equity (Latest) ⓘ | 92.11% | 50.38% |
| Profit Margin (Latest) ⓘ | 1.29% | 9.76% |
| Free Cash Flow (Latest) ⓘ | $939.59M | |
Momentum (Price trend) | ||
| 3Y Return ⓘ | +5.93% | +58.05% |
| 12M Return (excl. last month) ⓘ | +54.94% | +39.04% |
| 6M Return ⓘ | -13.32% | -3.91% |
| Price vs. 200-Day MA ⓘ | -6.77% | +1.90% |
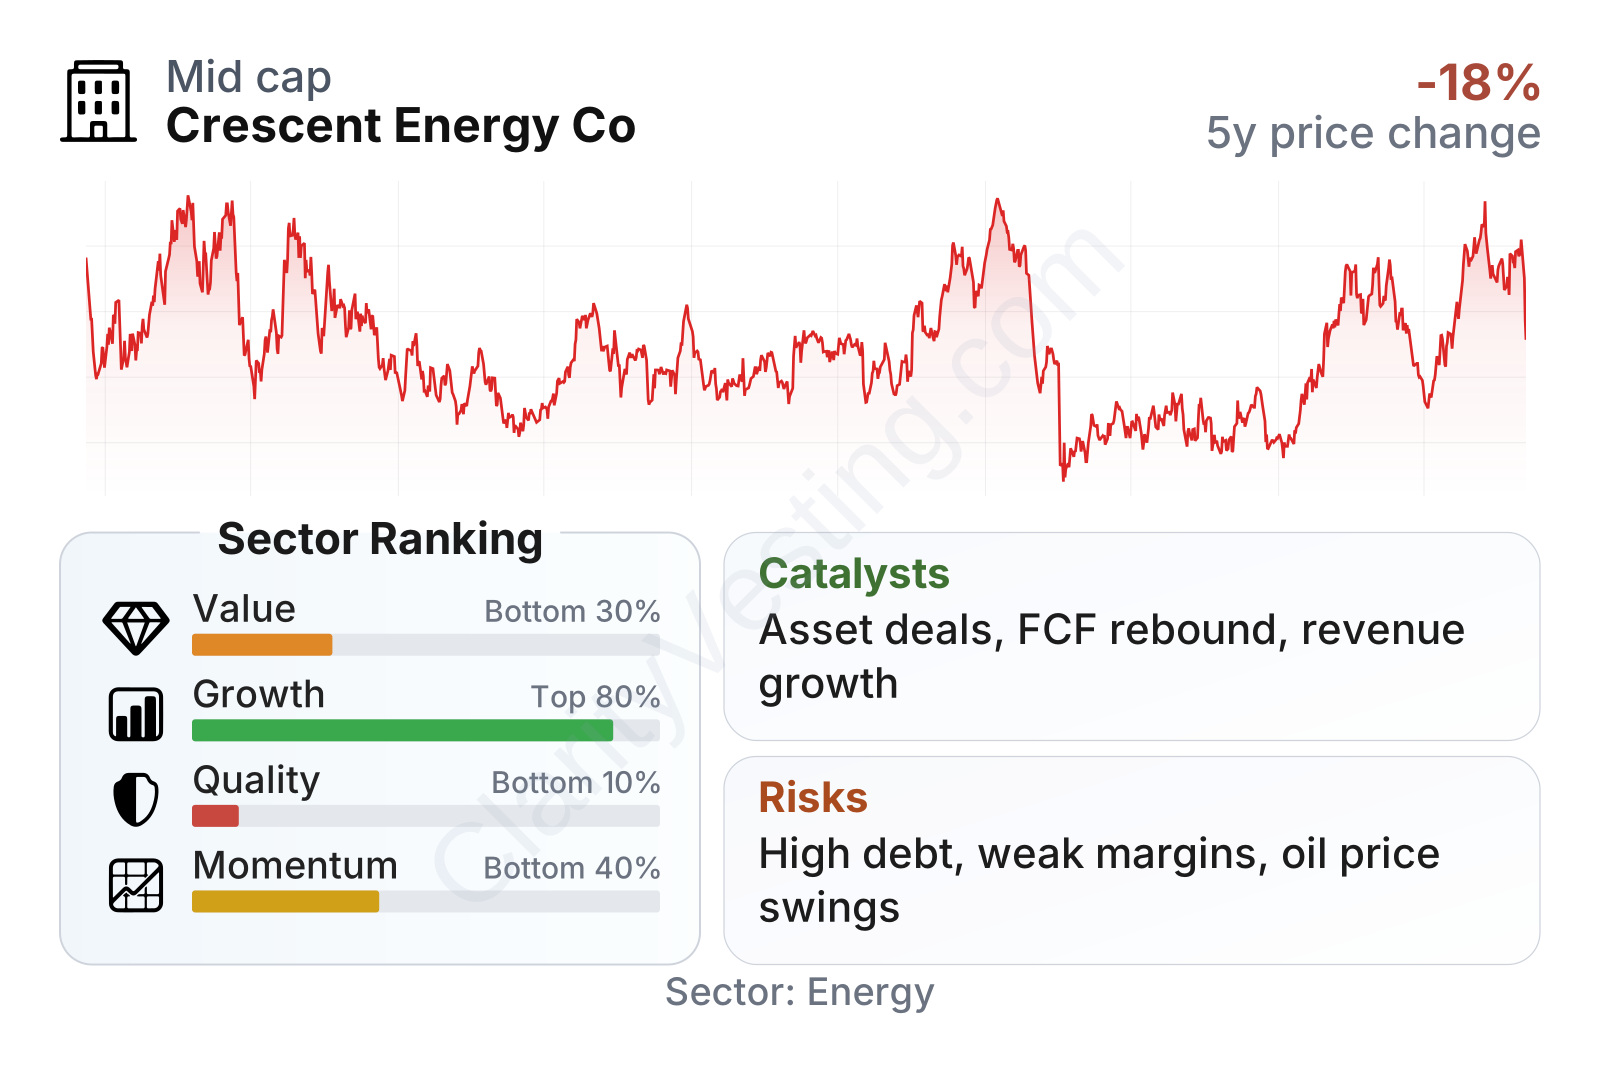
Crescent sits in the mid-cap range within the energy space, with a share-price pattern that has been volatile but not unusual for an oil and gas producer. The factor breakdown is mixed. Growth metrics rank relatively well versus the sector, helped by strong revenue expansion and improving book value per share. Cash generation also stands out, with free cash flow yield above the sector median and a dividend yield modestly above the peer median.
At the same time, quality metrics are weak. Profitability trails much of the sector, returns on capital are low, and leverage remains elevated. That contrast is important: Crescent currently looks stronger on expansion and cash extraction than on efficiency and balance-sheet strength.
Growth
Oil and gas production is not a classic high-growth sector, but it remains strategically important. Global energy demand, the need for reliable domestic supply, and limited willingness by many larger producers to pursue aggressive volume growth have created room for disciplined operators and consolidators. Crescent’s strategy fits that environment: it has focused on assembling producing assets, improving operational efficiency, and using scale to support cash generation.
Recent revenue growth has been strong, with year-over-year gains running well above the sector median in the latest readings. That suggests Crescent has been able to expand production and asset exposure at a faster pace than many peers, even though growth in this industry is rarely smooth from quarter to quarter. This is one of the more constructive parts of the company’s profile.
Free cash flow has been volatile, which is normal in a capital-intensive commodity business, but the latest trailing figure is strong in absolute terms. That matters because free cash flow is what can support debt reduction, dividends, and future acquisitions. In Crescent’s case, strong cash generation is one of the clearest reasons the company continues to attract attention despite weak accounting profitability.
A major catalyst is the company’s acquisition-led model. In the U.S. upstream market, there are still many mature assets changing hands as larger players reshape portfolios. Crescent has positioned itself as a buyer and operator of these properties, especially where it believes existing production can be maintained or improved with disciplined capital spending. If management continues integrating acquired assets effectively, scale could lift output and lower per-unit overhead over time.
Another positive element is portfolio diversification. Because Crescent is not tied to a single field or one narrow product mix, it has more flexibility than a one-basin producer. This can help smooth operational setbacks and create more optionality when capital is allocated across assets.
Recent company updates have also emphasized ongoing integration work, disciplined capital allocation, and shareholder returns through a base dividend. None of that removes commodity sensitivity, but it does suggest a strategy built around cash generation rather than pure production growth at any cost.
Risks
This article is for informational purposes only and does not constitute financial advice. Some content is AI-generated. See Disclaimer