Stock Analysis · China Resources Land Ltd (CRBJF)
Overview
China Resources Land Ltd is a large mainland China property company focused on residential development, investment properties, and related urban services. It is part of the broader China Resources group, a major state-backed conglomerate. In practical terms, the company builds and sells homes, owns and operates shopping malls and office properties, and also runs property management and asset operation activities tied to its real estate platform.
The business mix is important because China Resources Land is not only a homebuilder. Its recurring rental and management income gives it a steadier base than developers that rely almost entirely on apartment sales. Based on recent annual reporting, revenue is still led by development property sales, while investment property rental, property management, construction, and other value-added services make up the rest.
The main revenue sources can be summarized as follows:
- Development property sales: approximately 75% to 85% of revenue. This includes the sale of residential projects and some commercial development units.
- Property investment and operation: approximately 8% to 15% of revenue. This mainly includes rental income from shopping malls, offices, hotels, and other commercial assets.
- Property management and light-asset services: approximately 3% to 8% of revenue. This includes community services, commercial operation support, and management fees.
- Construction, urban redevelopment, and other businesses: a smaller share, generally below 10% combined, depending on project delivery timing.
This structure matters because the development segment tends to be cyclical and sensitive to China’s housing market, while rental and management activities usually produce more predictable cash flow. Over the last several years, total revenue has remained very large, with growth from 2021 to 2025, but profitability has become less stable as margins in property development came under pressure.
The business flow shows a company that still converts a very large revenue base into meaningful operating profit and net income, but with a clear squeeze compared with earlier years. Revenue rose from just above 210 billion yuan in 2021-2022 to roughly 277-279 billion yuan in 2024-2025, yet net income moved down from around 32 billion yuan in 2021 to roughly 25 billion yuan in 2025. That points to scale resilience, but also a tougher pricing and cost environment.
Key Figures
| Metric | Value | Sector ⓘ |
|---|---|---|
| Date | Oct 17, 2026 | |
| Context | ||
| Sector | Real Estate | |
| Industry | Real Estate - Development | |
| Market Cap ⓘ | $27.10B | |
| Beta ⓘ | 0.73 | |
Value (Cheapness) | ||
| P/E Ratio ⓘ | 7.60 | 17.38 |
| P/B Ratio ⓘ | 0.01 | 0.85 |
| FCF Yield ⓘ | 328.12% | 7.38% |
| Dividend Yield ⓘ | 30.68% | 4.85% |
| EBIT / EV ⓘ | N/A | 3.78% |
| PEG ⓘ | 0.60 | |
Growth (Business expansion) | ||
| Revenue Growth ⓘ | -28.50% | 5.30% |
| RPS Growth (5Y CAGR) ⓘ | 78.64% | 6.02% |
| EPS Growth (5Y CAGR) ⓘ | 23.99% | -11.37% |
| BVPS Growth (5Y CAGR) ⓘ | 53.08% | 0.45% |
| Margin Growth (5Y Trend) ⓘ | -9.23% | -0.22% |
| FCF Growth (5Y CAGR) ⓘ | 67.66% | 5.40% |
| DPS Growth (5Y CAGR) ⓘ | 69.26% | 5.02% |
Quality (Business durability) | ||
| ROIC (Latest) ⓘ | N/A | 5.69% |
| ROE (Latest) ⓘ | 22.28% | 7.56% |
| ROA (Latest) ⓘ | 4.45% | 2.85% |
| ROIC (5Y Median) ⓘ | 7.67% | 4.22% |
| ROE (5Y Median) ⓘ | 16.08% | 6.03% |
| ROA (5Y Median) ⓘ | 2.76% | 2.44% |
| Net Debt / EBIT (Latest) ⓘ | 1.49 | 7.59 |
| Net Debt / EBIT (5Y Median) ⓘ | 2.21 | 8.40 |
| Net Debt / EBITDA (Latest) ⓘ | 1.45 | 5.27 |
| Net Debt / Assets ⓘ | 16.50% | 37.76% |
| EBITDA / Interest ⓘ | 18.32 | 4.10 |
| Operating Margin (Latest) ⓘ | 21.86% | 35.29% |
| Operating Margin (5Y Median) ⓘ | 26.88% | 37.31% |
| Debt to Equity (Latest) ⓘ | 94.81% | 88.87% |
| Profit Margin (Latest) ⓘ | 9.19% | 19.61% |
| Free Cash Flow (Latest) ⓘ | $88.91B | |
Momentum (Price trend) | ||
| 3Y Return ⓘ | +6.27% | +30.75% |
| 12M Return (excl. last month) ⓘ | -3.81% | +4.36% |
| 6M Return ⓘ | +50.41% | -2.52% |
| Price vs. 200-Day MA ⓘ | +16.96% | -2.34% |
On broad fundamentals, China Resources Land stands out more on valuation and balance-sheet discipline than on recent market momentum. The company screens cheaply on earnings and especially on book value relative to most real estate peers, while profitability metrics such as return on equity and return on assets are above sector medians. Debt metrics also look controlled for a developer, with leverage ratios and interest coverage stronger than many peers in the same industry.
The weaker part of the picture is near-term growth quality. Recent year-over-year revenue growth is negative, margins have trended lower over five years, and the stock’s medium-term market performance has lagged the sector even after a rebound from its 2026 low. In short, the numbers describe a large company with real earnings power and unusually low valuation multiples, but operating in a difficult market that has reduced confidence in the whole sector.
Growth
China Resources Land operates in one of the most important but also most challenged sectors in China: residential and commercial real estate. The long-term need for housing, urban renewal, retail destinations, and integrated mixed-use projects remains significant, especially in top-tier and stronger second-tier cities. However, the sector is no longer in the easy expansion phase seen in earlier decades. Growth now depends less on broad housing booms and more on market share gains, land discipline, asset quality, and the ability to generate recurring income.
That is where the company’s strategy makes sense. Compared with many private developers that expanded too aggressively, China Resources Land has kept a more balanced model, combining property development with mall and office operations. This matters because commercial properties can support cash generation even when home sales slow. Its state-linked background also tends to help with financing access, land acquisition, and credibility with local governments and lenders.
The long-term revenue-per-share trend is strong overall, even if the latest jump appears unusually sharp and may reflect accounting or share-count effects rather than purely organic expansion. The more useful takeaway is that the company has built a larger revenue base over time instead of shrinking along with weaker developers.
The dividend record also points to a business that has continued producing distributable earnings through a difficult real estate cycle. While payout levels can fluctuate with profits and policy choices, the broader trend suggests that management has preserved room for shareholder returns rather than diverting all cash toward balance-sheet repair.
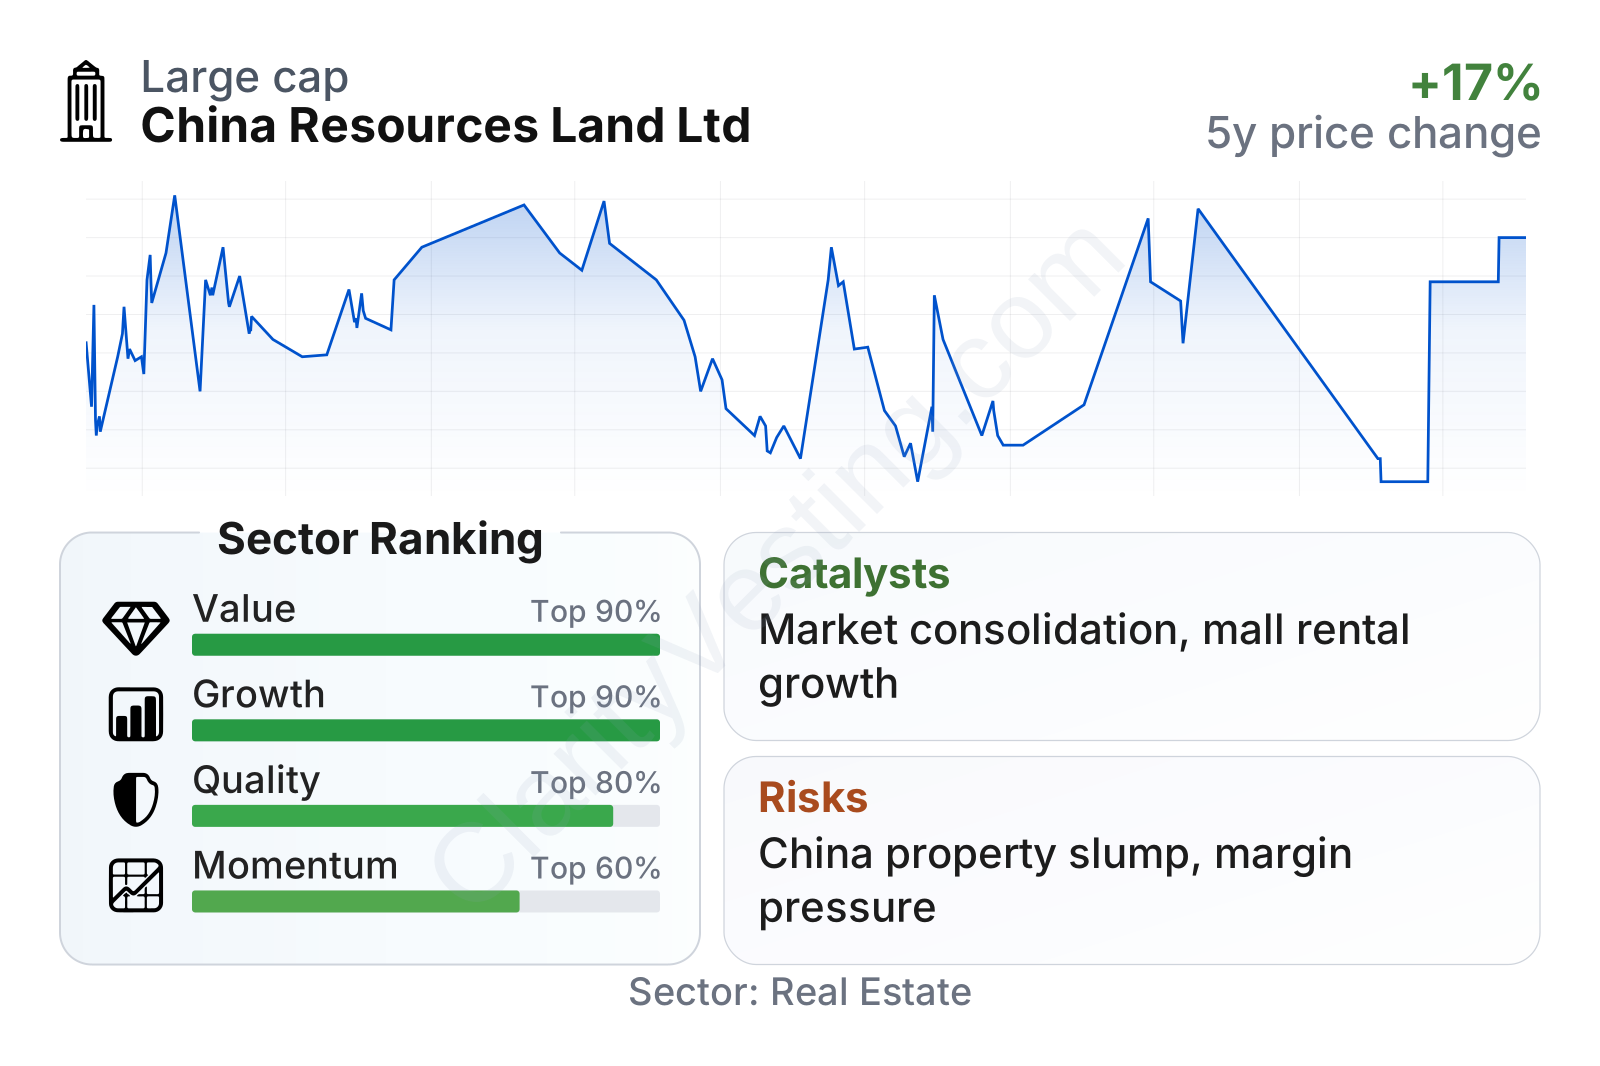
Potential catalysts for future growth are fairly specific. First, further consolidation in China’s property market could allow stronger state-backed groups to capture land, projects, and customers from weaker rivals. Second, the company’s investment property portfolio, especially large shopping centers in stronger cities, can gradually increase recurring rental income. Third, if Chinese housing policies continue shifting toward stabilization, financing support, project completion, and better demand conditions in core cities could benefit developers with relatively strong execution.
Recent corporate updates and annual reporting also indicate continued emphasis on high-quality cities, commercial property operations, and cash-flow discipline rather than aggressive volume growth. That is not the fastest path to expansion, but in the current environment it is a more credible one.
Risks
This article is for informational purposes only and does not constitute financial advice. Some content is AI-generated. See Disclaimer


