Stock Analysis · Crane Company (CR)
Overview
Crane Company is an industrial technology manufacturer focused on highly engineered products used in aerospace, defense, process industries, utilities, and payment systems. The company sells equipment that is often small compared with the total cost of the customer’s system, but critical for safety, reliability, or performance. That matters because customers tend to value product quality, certifications, installed-base support, and long replacement cycles more than lowest-price competition alone.
Following the separation of its former engineered materials business in recent years, Crane is now organized around two main operating segments: Aerospace & Electronics and Process Flow Technologies. Aerospace & Electronics includes components and systems used on commercial aircraft, military platforms, and space-related applications. Process Flow Technologies includes valves, pumps, lined pipe, and related fluid-handling products for chemical, pharmaceutical, water, and other industrial end markets.
Based on recent company reporting, revenue is primarily split between these two segments as follows:
- Aerospace & Electronics: approximately 55% to 60% of revenue. This includes sensing and control systems, fluid management components, power solutions, and other highly engineered parts for commercial aerospace, defense, and space programs.
- Process Flow Technologies: approximately 40% to 45% of revenue. This includes valves, pumps, instrumentation, and specialized fluid-handling equipment used in chemical processing, life sciences, utilities, and broader industrial applications.
The business mix gives Crane exposure to both long-cycle aerospace demand and recurring industrial replacement needs. It also helps explain why margins have improved: the portfolio is increasingly tilted toward products with tighter specifications, aftermarket content, and higher value-added engineering rather than more commodity-like industrial output.
The multi-year financial progression points to a business that has been expanding revenue while improving operating efficiency. Sales moved from a little above $2.0 billion in 2021 to roughly $2.3 billion in 2025, while operating income more than doubled over that span. Gross profit also advanced steadily, showing that the company has not relied only on volume growth but has also become more productive.
One notable pattern is that operating income has grown faster than revenue over the past few years. That usually signals a healthier mix, pricing discipline, and better cost absorption, all of which are important for a company serving specialized industrial niches.
Key Figures
| Metric | Value | Sector ⓘ |
|---|---|---|
| Date | Oct 24, 2026 | |
| Context | ||
| Sector | Industrials | |
| Industry | Specialty Industrial Machinery | |
| Market Cap ⓘ | $11.63B | |
| Beta ⓘ | 1.07 | |
Value (Cheapness) | ||
| P/E Ratio ⓘ | 36.01 | 22.29 |
| P/B Ratio ⓘ | 5.51 | 1.98 |
| FCF Yield ⓘ | 2.41% | 6.26% |
| Dividend Yield ⓘ | 0.47% | 1.92% |
| EBIT / EV ⓘ | 3.80% | 4.83% |
| PEG ⓘ | 2.32 | |
Growth (Business expansion) | ||
| Revenue Growth ⓘ | 25.60% | 9.30% |
| RPS Growth (5Y CAGR) ⓘ | 3.08% | 7.76% |
| EPS Growth (5Y CAGR) ⓘ | -19.34% | -13.17% |
| BVPS Growth (5Y CAGR) ⓘ | 3.22% | 6.13% |
| Margin Growth (5Y Trend) ⓘ | 9.60% | 0.74% |
| FCF Growth (5Y CAGR) ⓘ | -6.51% | 10.79% |
| DPS Growth (5Y CAGR) ⓘ | -14.63% | 9.41% |
Quality (Business durability) | ||
| ROIC (Latest) ⓘ | N/A | 10.75% |
| ROA (Latest) ⓘ | 10.22% | 5.41% |
| ROIC (5Y Median) ⓘ | 14.70% | 9.37% |
| ROA (5Y Median) ⓘ | 9.57% | 4.95% |
| Net Debt / EBIT (Latest) ⓘ | 1.60 | 2.04 |
| Net Debt / EBIT (5Y Median) ⓘ | 0.04 | 2.27 |
| Net Debt / EBITDA (Latest) ⓘ | 1.37 | 1.39 |
| Net Debt / Assets ⓘ | 18.99% | 19.27% |
| EBITDA / Interest ⓘ | 15.55 | 9.58 |
| Operating Margin (Latest) ⓘ | 18.45% | 10.49% |
| Operating Margin (5Y Median) ⓘ | 14.90% | 10.30% |
| Debt to Equity (Latest) ⓘ | 51.24% | 64.82% |
| Profit Margin (Latest) ⓘ | 12.97% | 6.67% |
| Free Cash Flow (Latest) ⓘ | $280.40M | |
Momentum (Price trend) | ||
| 3Y Return ⓘ | +147.05% | +67.77% |
| 12M Return (excl. last month) ⓘ | +9.85% | +12.05% |
| 6M Return ⓘ | +10.57% | 0.00% |
| Price vs. 200-Day MA ⓘ | +3.35% | +0.67% |
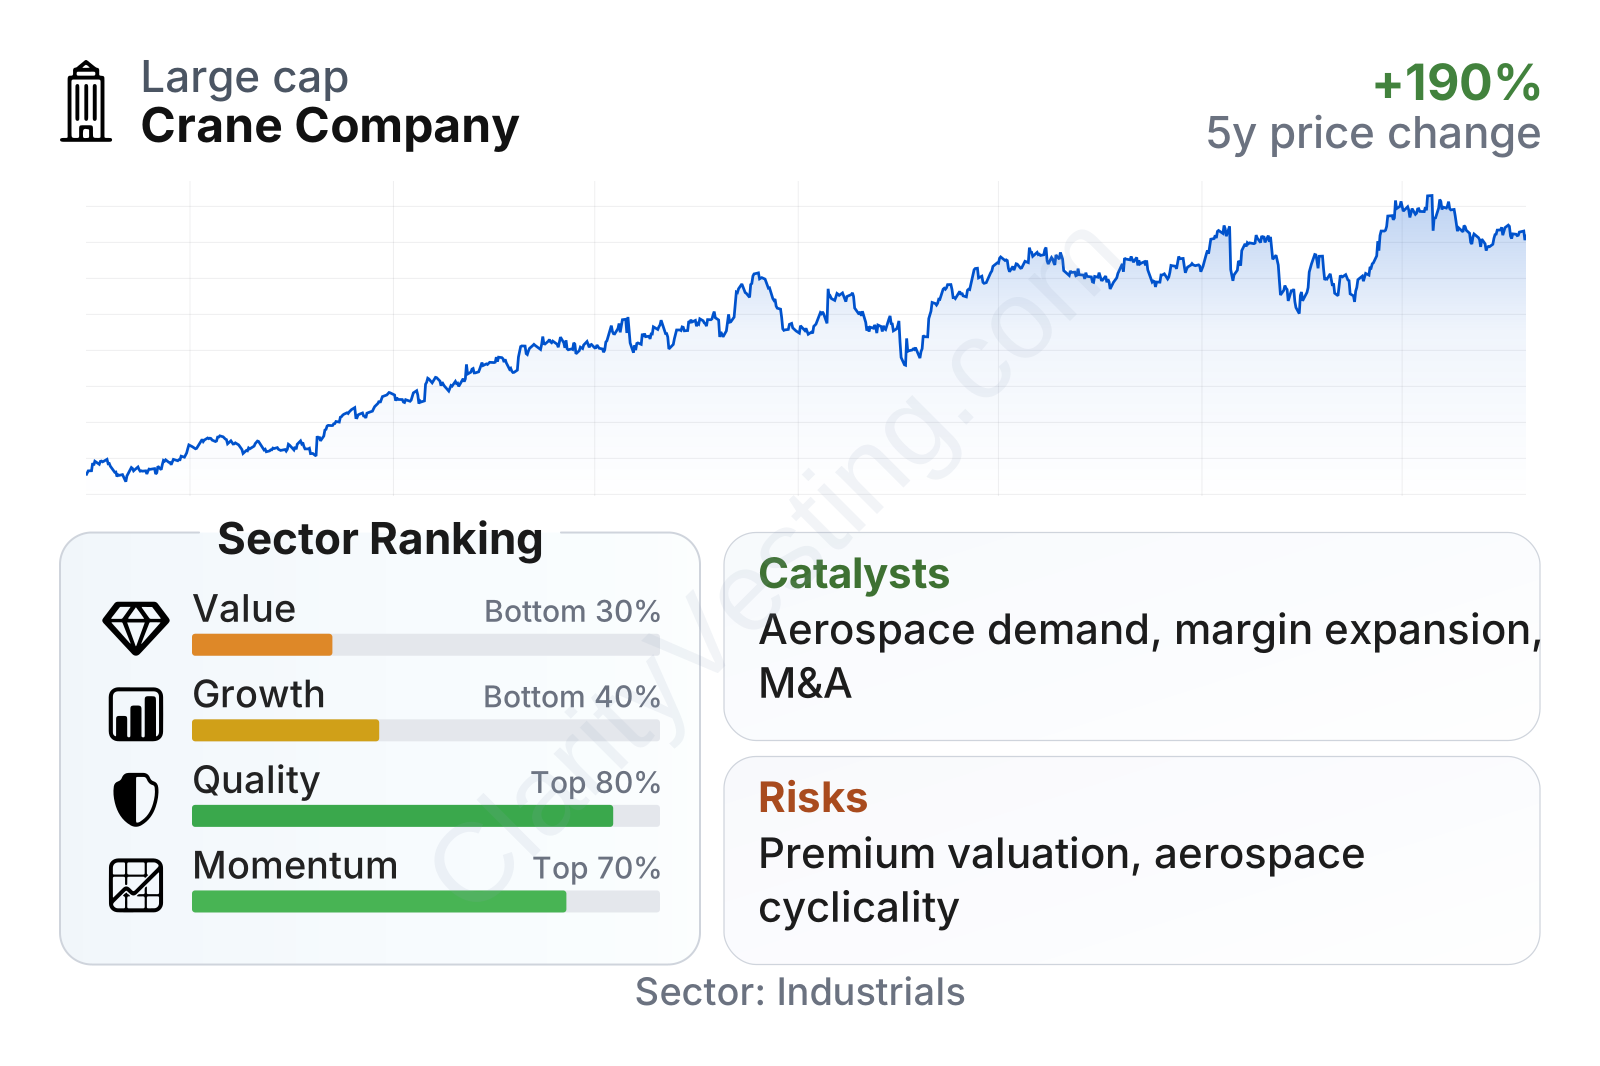
Crane is a mid-to-large industrial company with a market value around $12 billion and share-price volatility close to the broader market. The quality profile stands out more than the value profile: profitability, returns on assets, margin levels, and interest coverage are all stronger than many peers. By contrast, valuation multiples sit above sector medians, which means the market is already recognizing a meaningful portion of that business quality.
The growth profile is more mixed than it first appears. Recent year-over-year revenue growth has been strong, but longer-term per-share growth and cash flow compounding have been less impressive than the recent surge suggests. Momentum has still been favorable, with the stock materially outperforming the sector over three years and remaining above its long-term trend.
Growth
Crane operates in end markets with solid structural support, especially aerospace and defense. Commercial aerospace continues to benefit from aircraft production recovery, fleet utilization, and a large installed base that needs replacement parts and maintenance support. Defense demand is supported by government budgets and program visibility that can extend for many years. In industrial flow products, demand tends to be tied to maintenance, process reliability, regulatory standards, and specialized applications where product failure can be very costly.
Its strategy also appears coherent for long-term expansion. Crane has been reshaping itself toward higher-margin niches where certifications, engineering know-how, and customer qualification cycles create barriers to entry. That makes sense because it can support better margins and steadier recurring revenue than broader, more price-sensitive industrial categories.
Recent revenue growth has accelerated meaningfully, with the latest year-over-year pace well above the sector median. Some of that reflects favorable end-market conditions and portfolio actions, but it still shows that demand has been healthy across key businesses. The main point for long-term readers is that Crane is not relying on a stagnant industrial backdrop; several of its end markets are currently supportive.
Cash generation has also improved sharply from the negative level seen in 2023. Free cash flow recovered and then remained in a healthy positive range, which is important because it gives the company room to fund acquisitions, internal investment, debt management, and dividends without depending heavily on external financing.
A meaningful catalyst is the company’s exposure to aerospace content on platforms that can benefit both from new production and aftermarket demand. Another is continued margin expansion if management keeps shifting the business toward more specialized products. Bolt-on acquisitions could also remain part of the growth plan, especially in areas where Crane can add technology or channel reach without stretching the balance sheet too far.
Recent company communications have also emphasized order strength, backlog support, and continued demand in aerospace, defense, and certain process markets. That does not remove cyclicality, but it does suggest the company entered 2026 with favorable operating momentum rather than trying to recover from a weak base.
Risks
This article is for informational purposes only and does not constitute financial advice. Some content is AI-generated. See Disclaimer