Stock Analysis · Centrica plc (CPYYF)
Overview
Centrica plc is a British energy company best known for supplying gas and electricity to homes and businesses, mainly through the British Gas brand in the United Kingdom. Beyond retail supply, it also operates in energy services, power generation, energy trading, and upstream gas production. In simple terms, Centrica sits across several parts of the energy chain: it sells energy to customers, helps them manage heating and energy systems, trades and optimizes energy, and owns some assets that produce power or gas.
This mix matters because Centrica is not only exposed to one revenue stream. Its earnings can come from customer accounts, service contracts, trading activity, and asset-backed energy production. That said, the group has become more focused in recent years on customer supply, energy services, flexibility, and security of supply rather than on being a broad international utility.
Based on company reporting, Centrica’s revenue is still dominated by its supply and optimization activities. Approximate revenue exposure can be described as follows, although reported mixes can shift meaningfully from year to year because energy prices and trading volumes are volatile:
- Retail energy supply and related customer activity: approximately 55% to 65% of group revenue. This includes residential and business gas and electricity sales, mainly in the U.K. and Ireland.
- Energy trading, optimization, and wholesale-related activity: approximately 20% to 30%. This includes route-to-market services, commodity trading, and optimization of flexible energy assets.
- Energy services and solutions: approximately 10% to 15%. This includes boiler services, maintenance, installations, and commercial energy solutions.
- Upstream and power generation-related activity: generally below 10% of revenue, though sometimes more important for profit than for sales. This includes interests in gas production and flexible generation assets.
One important point for long-term readers: in energy companies like Centrica, revenue does not always tell the full story. Large revenue lines can carry thin margins, while smaller divisions such as trading optimization or upstream production can have a much bigger effect on profit.
The multiyear profit flow shows exactly that kind of volatility. Revenue expanded sharply during the energy crisis, then moderated, while operating profit and net income moved far more dramatically from year to year. That pattern is typical for companies tied to commodity prices, regulation, and one-off charges.
The broad trend is that Centrica remained a large revenue business, but the conversion from sales into profit has been uneven. Profitability improved strongly in 2023, eased in 2024, and the latest annual flow still suggests that headline earnings can swing much more than underlying operations.
Key Figures
| Metric | Value | Sector ⓘ |
|---|---|---|
| Date | Oct 17, 2026 | |
| Context | ||
| Sector | Utilities | |
| Industry | Utilities - Independent Power Producers | |
| Market Cap ⓘ | $8.15B | |
| Beta ⓘ | 0.36 | |
Value (Cheapness) | ||
| P/E Ratio ⓘ | 9.00 | 17.28 |
| P/B Ratio ⓘ | 2.42 | 1.51 |
| FCF Yield ⓘ | 0.74% | 0.65% |
| Dividend Yield ⓘ | 3.00% | 3.77% |
| EBIT / EV ⓘ | N/A | 5.01% |
| PEG ⓘ | 0.44 | |
Growth (Business expansion) | ||
| Revenue Growth ⓘ | 0.60% | 6.10% |
| RPS Growth (5Y CAGR) ⓘ | 13.01% | 3.87% |
| EPS Growth (5Y CAGR) ⓘ | -4.92% | -11.30% |
| BVPS Growth (5Y CAGR) ⓘ | 8.68% | 4.23% |
| Margin Growth (5Y Trend) ⓘ | 24.51% | 3.57% |
| FCF Growth (5Y CAGR) ⓘ | -27.89% | -8.84% |
| DPS Growth (5Y CAGR) ⓘ | 49.21% | 4.84% |
Quality (Business durability) | ||
| ROIC (Latest) ⓘ | N/A | 6.53% |
| ROA (Latest) ⓘ | 2.71% | 3.20% |
| ROIC (5Y Median) ⓘ | 0.28% | 5.95% |
| ROA (5Y Median) ⓘ | 5.47% | 2.75% |
| Net Debt / EBIT (Latest) ⓘ | -0.12 | 7.13 |
| Net Debt / EBIT (5Y Median) ⓘ | -0.28 | 7.23 |
| Net Debt / EBITDA (Latest) ⓘ | -0.11 | 4.31 |
| Net Debt / Assets ⓘ | -4.67% | 38.42% |
| EBITDA / Interest ⓘ | 18.84 | 4.58 |
| Operating Margin (Latest) ⓘ | 15.60% | 20.83% |
| Operating Margin (5Y Median) ⓘ | 9.78% | 20.08% |
| Debt to Equity (Latest) ⓘ | 80.68% | 137.69% |
| Profit Margin (Latest) ⓘ | 3.64% | 11.37% |
| Free Cash Flow (Latest) ⓘ | $60.63M | |
Momentum (Price trend) | ||
| 3Y Return ⓘ | +8.32% | +52.37% |
| 12M Return (excl. last month) ⓘ | -0.74% | +8.84% |
| 6M Return ⓘ | -32.12% | -3.95% |
| Price vs. 200-Day MA ⓘ | -13.52% | -0.79% |
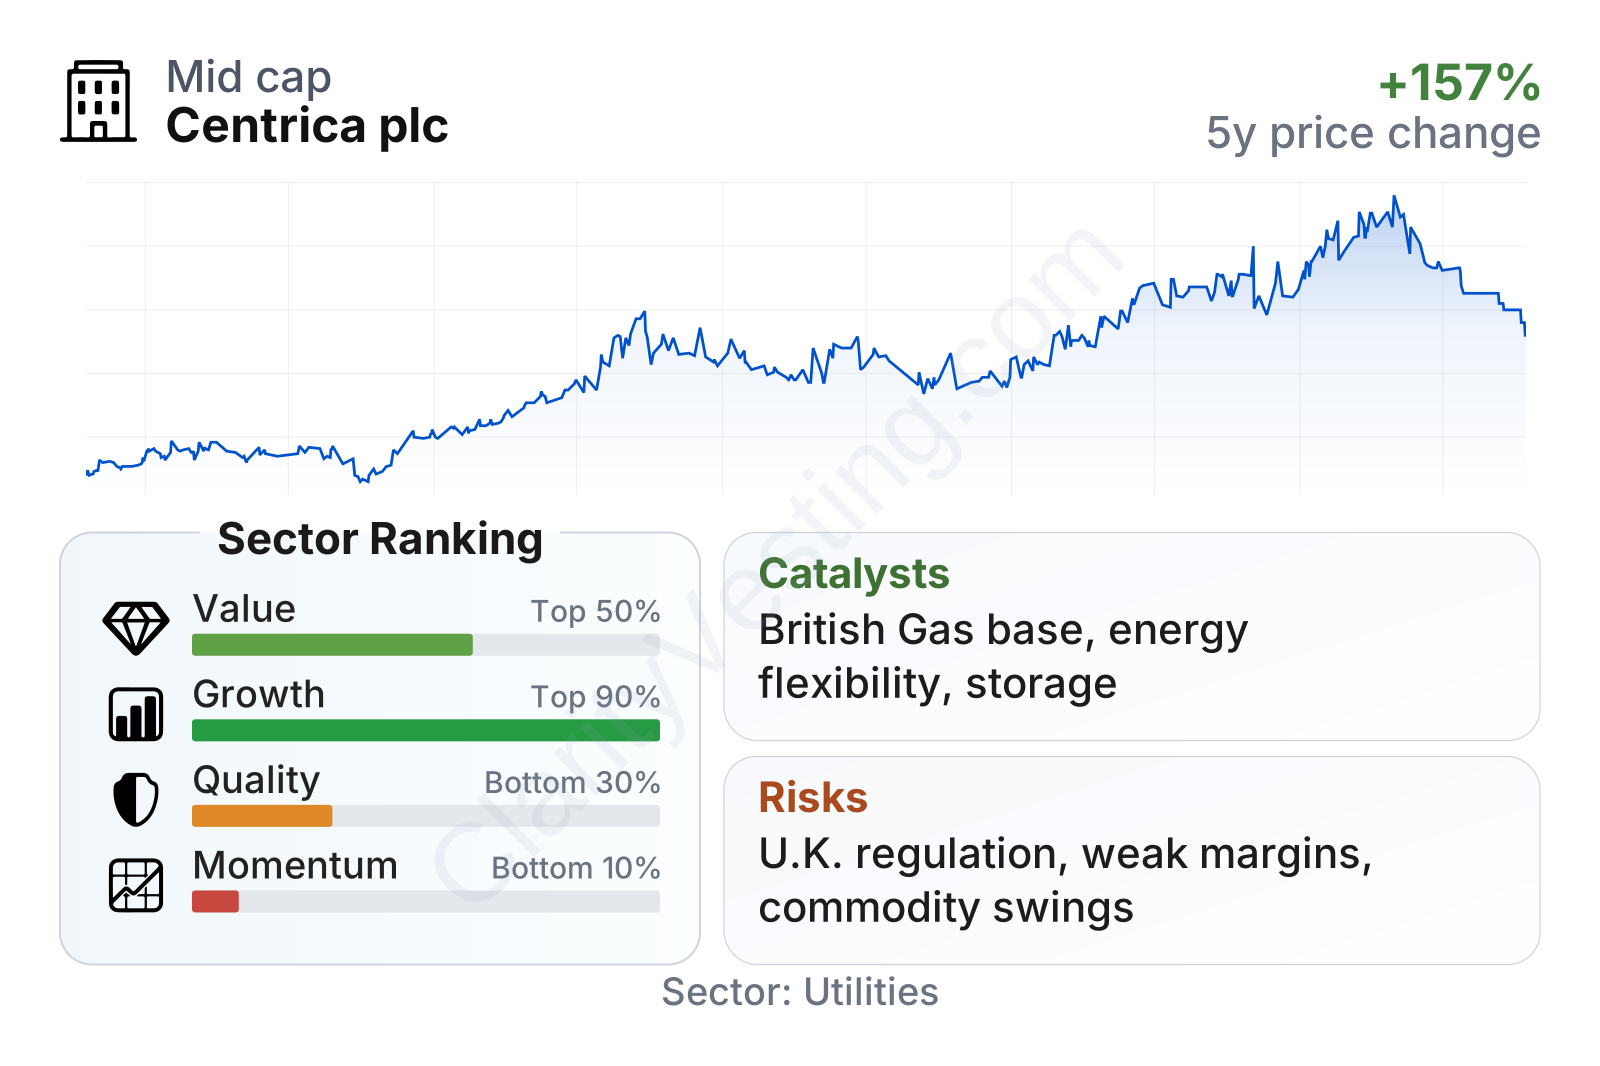
Centrica is a large utility-sized company with unusually low share-price volatility for an energy name, reflected in a beta well below 1. In valuation terms, the stock trades on a lower earnings multiple than the sector median, while its price-to-book ratio is higher than the median. That combination usually means the market is giving some credit for balance-sheet strength or business resilience, but not assigning a premium growth multiple.
The table also shows a mixed profile. Growth characteristics rank strongly versus the sector, helped by five-year revenue-per-share expansion, book value growth, and a very strong improvement in operating margin over time. However, quality metrics are weaker overall because profitability ratios remain modest for the sector and free cash flow has been less consistent than the income statement alone might suggest. Momentum is the weakest area, with the recent share-price trend lagging much of the sector despite a strong rise over the longer period shown above.
Growth
Centrica operates in a sector that is changing rather than disappearing. Traditional utility supply is mature, but the broader energy market is being reshaped by electrification, decarbonization, energy security concerns, flexible generation, home services, and demand management. That creates a more attractive long-term backdrop for companies that can combine customer relationships with infrastructure, storage, optimization, and service capabilities.
Centrica’s strategy broadly fits that direction. The company has a large customer base, a well-known domestic brand, and a presence in areas that matter more in modern energy systems: energy services, connected home solutions, flexible power, storage, and energy trading. These activities can become more valuable as grids become more intermittent and customers seek help managing usage, heating, and energy costs.
The revenue-per-share trend has been strong over the last five years despite recent normalization after the peak of the energy crisis. That suggests the business has not merely benefited from temporary pricing spikes; it has also retained meaningful scale. Still, short-term growth has slowed considerably, so the main long-term question is whether Centrica can turn scale and customer reach into steadier, higher-quality earnings.
Several practical catalysts support that possibility. U.K. energy systems need more balancing, backup capacity, and customer-side optimization. British Gas gives Centrica direct access to millions of households that may eventually adopt heat pumps, smart controls, battery-related services, and broader home energy management. On the business side, companies are looking for reliability, efficiency, and carbon management support, which can expand demand for energy solutions beyond basic commodity supply.
Another supportive factor is energy security. Since Europe’s gas shock, governments and businesses have placed greater value on storage, flexibility, and domestic supply resilience. Centrica has exposure to these themes through gas storage and related energy infrastructure, which can strengthen its strategic relevance even when commodity prices cool.
Risks
This article is for informational purposes only and does not constitute financial advice. Some content is AI-generated. See Disclaimer


