Stock Analysis · Corcept Therapeutics Incorporated (CORT)
Overview
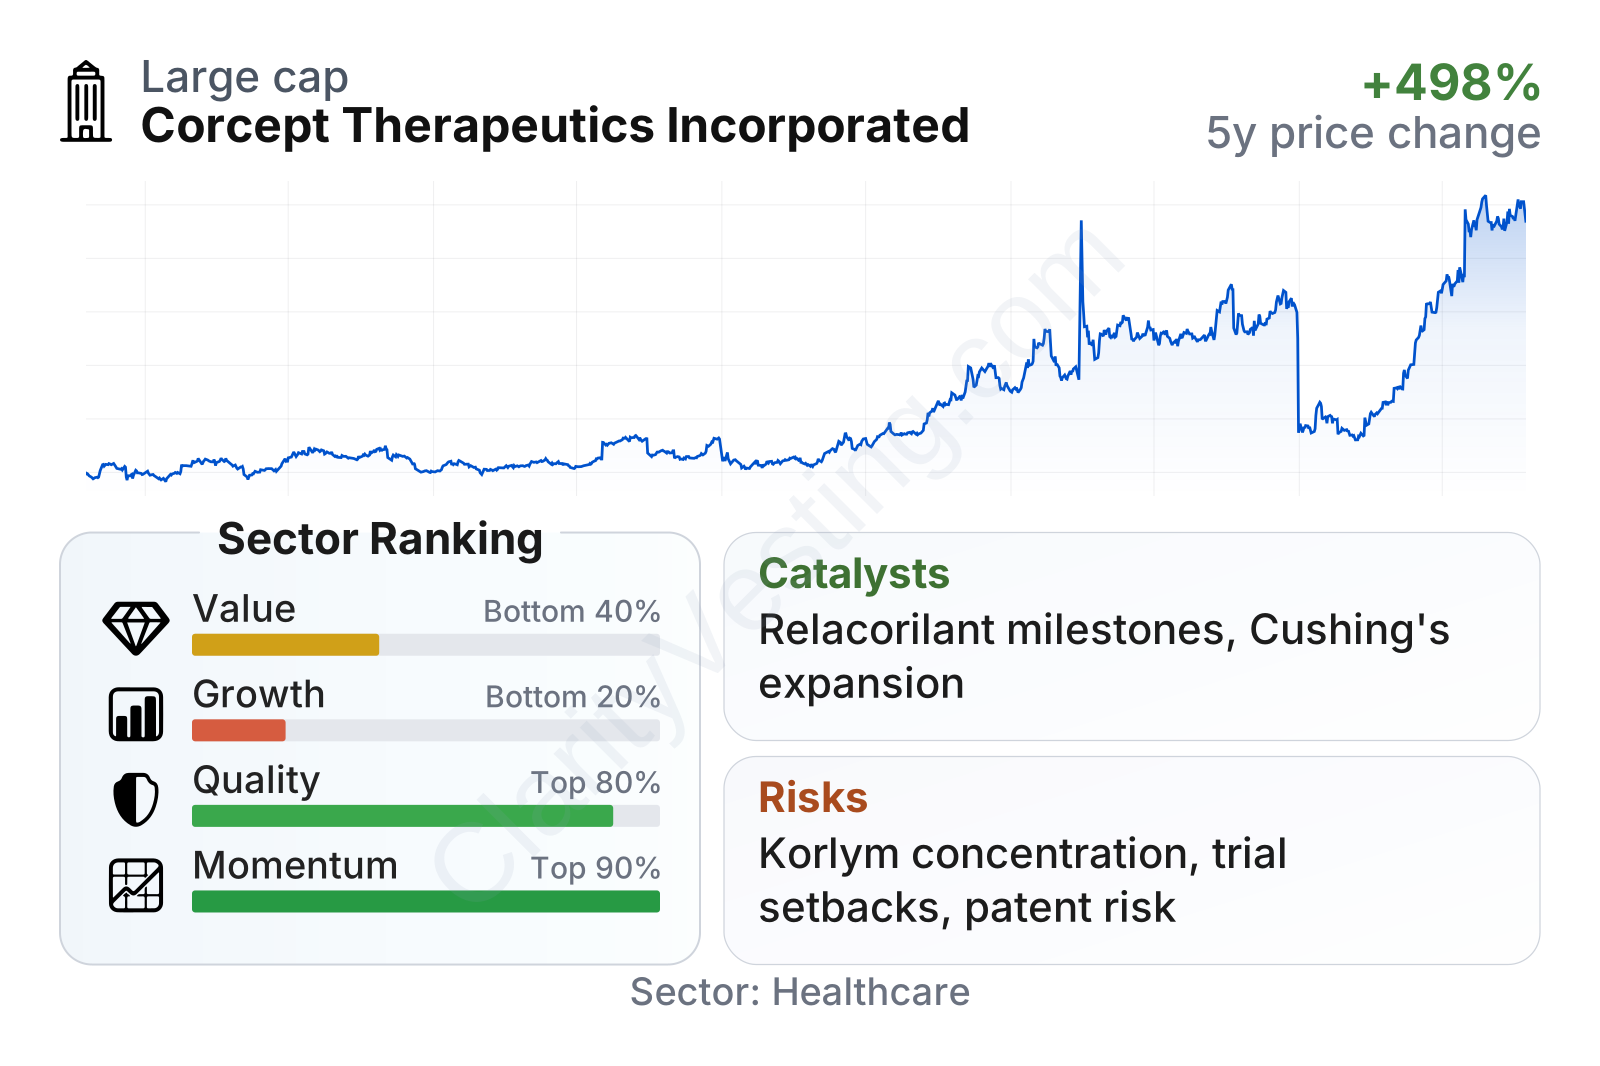
Corcept Therapeutics Incorporated is a biotechnology company focused on drugs that regulate the effects of cortisol, a hormone involved in stress response, metabolism, and several serious diseases. Its commercial foundation today is Cushing’s syndrome, a rare disorder caused by excessive cortisol, but the company is also trying to expand into oncology and other endocrine-related conditions. In simple terms, Corcept specializes in medicines that block or fine-tune cortisol activity, and it is using that expertise to build a broader pipeline.
The business is still highly concentrated. Based on recent company filings, revenue comes overwhelmingly from one marketed product, with the rest made up of small ancillary items.
- Korlym (mifepristone) product sales: approximately 99%+ of total revenue. Korlym is approved in the United States to control high blood sugar secondary to hypercortisolism in certain adults with endogenous Cushing’s syndrome who have type 2 diabetes mellitus or glucose intolerance and are not candidates for surgery or have not responded to surgery.
- Other revenue: less than 1%. This generally includes small non-product items and does not currently change the overall business picture in a meaningful way.
That concentration makes Corcept easy to understand: it is currently a profitable specialty-biopharma company built on one main drug, while spending heavily to create the next phase of growth through new indications and new products. Another notable feature is its economics. The cost of making and selling the drug is very low relative to revenue, so gross margin is exceptionally high. The pressure point is not manufacturing but operating expenses, especially research and development and selling costs, which have risen sharply as the pipeline and commercial effort expanded.
The long-term pattern is clear: revenue has risen strongly over the last several years, but expenses have climbed even faster in the most recent period. That helps explain why Corcept can show impressive sales growth while also seeing profitability narrow.
Key Figures
| Metric | Value | Sector ⓘ |
|---|---|---|
| Date | Oct 17, 2026 | |
| Context | ||
| Sector | Healthcare | |
| Industry | Biotechnology | |
| Market Cap ⓘ | $12.56B | |
| Beta ⓘ | 0.40 | |
Value (Cheapness) | ||
| P/E Ratio ⓘ | 264.16 | 24.79 |
| P/B Ratio ⓘ | 19.02 | 3.08 |
| FCF Yield ⓘ | 0.85% | 3.15% |
| Dividend Yield ⓘ | N/A | 1.94% |
| EBIT / EV ⓘ | 0.22% | 0.57% |
| PEG ⓘ | 0.81 | |
Growth (Business expansion) | ||
| Revenue Growth ⓘ | 31.70% | 7.45% |
| RPS Growth (5Y CAGR) ⓘ | 21.57% | 8.61% |
| EPS Growth (5Y CAGR) ⓘ | -51.15% | -17.81% |
| BVPS Growth (5Y CAGR) ⓘ | 15.98% | 3.72% |
| Margin Growth (5Y Trend) ⓘ | -25.28% | -0.62% |
| FCF Growth (5Y CAGR) ⓘ | -4.07% | 1.04% |
| DPS Growth (5Y CAGR) ⓘ | N/A | 6.77% |
Quality (Business durability) | ||
| ROIC (Latest) ⓘ | 8.84% | 3.24% |
| ROA (Latest) ⓘ | 6.41% | 3.01% |
| ROIC (5Y Median) ⓘ | 22.40% | 4.60% |
| ROA (5Y Median) ⓘ | 19.11% | 1.89% |
| Net Debt / EBIT (Latest) ⓘ | -3.85 | 1.34 |
| Net Debt / EBIT (5Y Median) ⓘ | -0.75 | 1.84 |
| Net Debt / EBITDA (Latest) ⓘ | -3.53 | 1.00 |
| Net Debt / Assets ⓘ | -11.43% | 5.45% |
| EBITDA / Interest ⓘ | N/A | 9.64 |
| Operating Margin (Latest) ⓘ | 3.17% | 9.27% |
| Operating Margin (5Y Median) ⓘ | 25.82% | 7.38% |
| Debt to Equity (Latest) ⓘ | 1.33% | 28.58% |
| Profit Margin (Latest) ⓘ | 6.64% | 3.59% |
| Free Cash Flow (Latest) ⓘ | $106.92M | |
Momentum (Price trend) | ||
| 3Y Return ⓘ | +303.60% | +42.80% |
| 12M Return (excl. last month) ⓘ | +59.38% | +18.50% |
| 6M Return ⓘ | +158.25% | +7.57% |
| Price vs. 200-Day MA ⓘ | +58.42% | +5.12% |
Corcept is now a large biotech company by market value, and its share price has been far less volatile than many biotechnology peers, as shown by its low beta. The company stands out for balance-sheet strength and solid returns on capital over time, which is unusual in biotech. At the same time, the table also points to a market valuation that is much richer than the sector median, while recent earnings-based growth quality looks weaker than revenue growth alone would suggest.
Growth
Corcept operates in a favorable part of healthcare. Endocrine disorders and cancer remain areas of significant unmet need, and companies with targeted therapies can grow for long periods if they expand approved uses, add new products, or move into related diseases. Corcept’s strategy fits that model. It is using cash flow from Korlym to fund a pipeline of selective cortisol modulators that could potentially improve on the current franchise and reduce dependence on a single product.
Revenue growth has been strong overall, with recent year-over-year growth well above the broader healthcare sector median. The pattern has not been perfectly smooth, but the business has clearly scaled up over time. That matters because it shows Korlym still has room to grow commercially, even before any major new product launch.
A key part of the long-term case is the transition from one commercial asset to a multi-asset company. Corcept’s internal pipeline includes relacorilant and dazucorilant, among other candidates. Relacorilant has been one of the company’s most important programs because it has been studied both in Cushing’s syndrome and in combinations for cancer. If Corcept can win approvals in additional endocrine settings or establish a credible position in oncology, the addressable market could become much larger than its current niche.
Recent company updates have also highlighted continued progress with the Cushing’s franchise beyond Korlym, including work around relacorilant and other cortisol modulators. For a company of this type, regulatory milestones, pivotal trial results, and eventual label expansion decisions are the strongest growth catalysts because they can quickly reshape future revenue expectations.
Cash generation remains a positive, even though it has become less consistent than revenue growth. Corcept is still producing positive free cash flow, which is important because it allows the company to finance development without relying heavily on new debt or frequent equity issuance. In biotech, that self-funding profile is a meaningful strategic advantage.
Risks
This article is for informational purposes only and does not constitute financial advice. Some content is AI-generated. See Disclaimer


