Stock Analysis · ConocoPhillips (COP)
Overview
ConocoPhillips is one of the world’s largest independent oil and gas exploration and production companies. In simple terms, it looks for hydrocarbon resources, develops wells and related infrastructure, produces crude oil, bitumen, natural gas, natural gas liquids, and liquefied natural gas, and then sells those commodities into global markets. Unlike integrated majors such as Exxon Mobil or Chevron, ConocoPhillips is focused mainly on the upstream side of the energy value chain, meaning it does not rely on large refining or retail fuel station operations to balance its business.
Its asset base is spread across North America, Europe, Asia-Pacific, the Middle East, and Africa, with especially important positions in the Lower 48 states of the U.S., Alaska, Canada, Norway, Qatar, Libya, China, Australia, and Malaysia. That geographic mix matters because it gives the company exposure to several pricing hubs and project types, from shale drilling in the Permian and Eagle Ford to LNG-linked developments and conventional offshore fields.
Revenue comes primarily from selling produced commodities. Based on the company’s recent annual disclosures, the mix changes with prices and production, but the broad revenue structure is centered on a few large streams:
- Crude oil: approximately 50% to 55% of total revenue. This is the largest source and includes oil production from U.S. shale, Alaska, Canada, Norway, Libya, and other international assets.
- Natural gas: approximately 20% to 25%. This includes pipeline gas sold in North America and international markets.
- Natural gas liquids and bitumen: approximately 15% to 20%. This category includes products such as condensate and NGLs, as well as heavy oil and bitumen output from Canada.
- LNG-linked and other marketed volumes: generally a small-to-midsingle-digit share of reported revenue depending on trading, transportation, and partner arrangements.
What stands out in ConocoPhillips’ business model is that management has deliberately concentrated on low-cost supply resources. The goal is to keep generating cash even when oil and gas prices are less favorable than during boom years. The company also emphasizes flexible capital spending, which is important in a cyclical industry where prices can swing sharply from one year to the next.
The multi-year earnings flow shows clearly how sensitive the business is to commodity prices. Revenue and profit surged in 2022 when oil and gas prices were unusually strong, then normalized in 2023 through 2025. Even after that cooldown, the company remained solidly profitable, which suggests that its portfolio is more resilient than many smaller exploration and production peers.
Key Figures
| Metric | Value | Sector ⓘ |
|---|---|---|
| Date | Oct 24, 2026 | |
| Context | ||
| Sector | Energy | |
| Industry | Oil & Gas E&P | |
| Market Cap ⓘ | $175.34B | |
| Beta ⓘ | 0.24 | |
Value (Cheapness) | ||
| P/E Ratio ⓘ | 19.33 | 15.40 |
| P/B Ratio ⓘ | 2.71 | 1.71 |
| FCF Yield ⓘ | 5.74% | 8.24% |
| Dividend Yield ⓘ | 2.27% | 3.52% |
| EBIT / EV ⓘ | 9.32% | 7.45% |
| PEG ⓘ | 1.08 | |
Growth (Business expansion) | ||
| Revenue Growth ⓘ | 35.50% | 26.85% |
| RPS Growth (5Y CAGR) ⓘ | 8.05% | 6.78% |
| EPS Growth (5Y CAGR) ⓘ | -22.74% | -14.41% |
| BVPS Growth (5Y CAGR) ⓘ | 10.76% | 6.08% |
| Margin Growth (5Y Trend) ⓘ | -6.63% | 0.55% |
| FCF Growth (5Y CAGR) ⓘ | -11.24% | 2.75% |
| DPS Growth (5Y CAGR) ⓘ | 15.74% | 16.79% |
Quality (Business durability) | ||
| ROIC (Latest) ⓘ | 11.39% | 11.30% |
| ROA (Latest) ⓘ | 7.52% | 6.00% |
| ROIC (5Y Median) ⓘ | 15.91% | 10.35% |
| ROA (5Y Median) ⓘ | 10.54% | 5.46% |
| Net Debt / EBIT (Latest) ⓘ | 1.06 | 1.64 |
| Net Debt / EBIT (5Y Median) ⓘ | 1.08 | 1.82 |
| Net Debt / EBITDA (Latest) ⓘ | 0.61 | 1.08 |
| Net Debt / Assets ⓘ | 13.45% | 17.29% |
| EBITDA / Interest ⓘ | 23.34 | 9.53 |
| Operating Margin (Latest) ⓘ | 24.94% | 16.21% |
| Operating Margin (5Y Median) ⓘ | 30.20% | 20.55% |
| Debt to Equity (Latest) ⓘ | 35.64% | 52.27% |
| Profit Margin (Latest) ⓘ | 14.40% | 8.79% |
| Free Cash Flow (Latest) ⓘ | $10.06B | |
Momentum (Price trend) | ||
| 3Y Return ⓘ | +27.61% | +68.93% |
| 12M Return (excl. last month) ⓘ | +43.11% | +42.90% |
| 6M Return ⓘ | +22.84% | +9.18% |
| Price vs. 200-Day MA ⓘ | +23.03% | +9.87% |
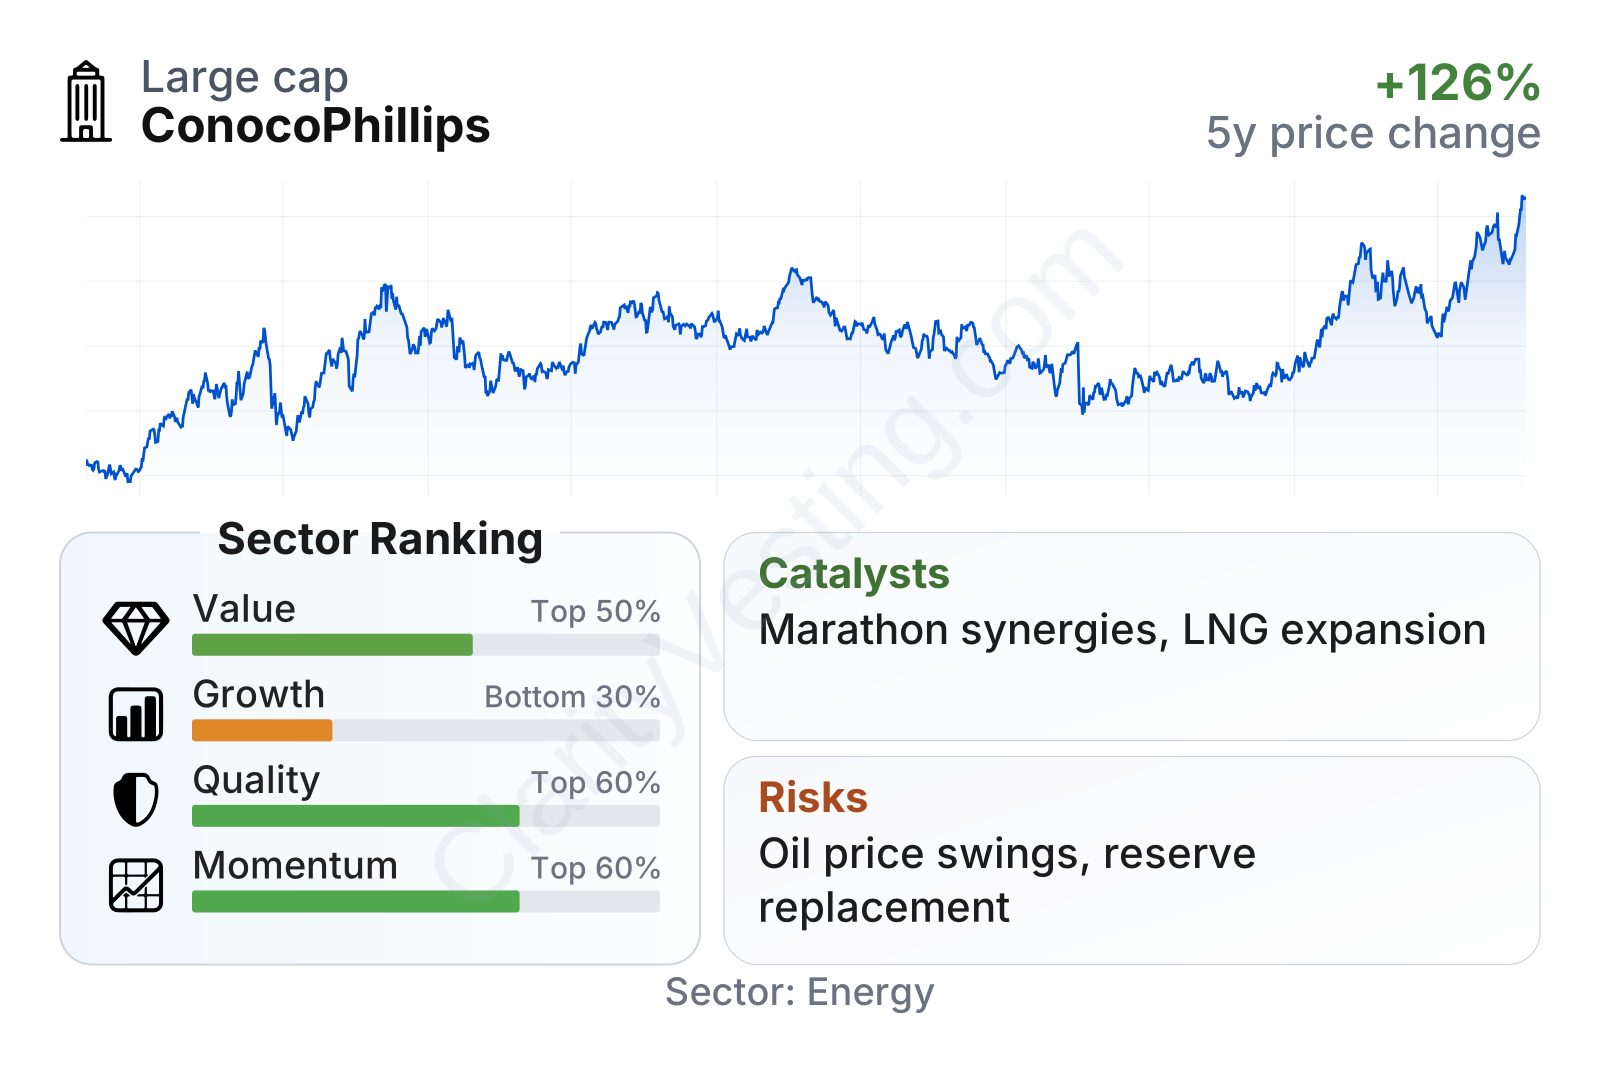
ConocoPhillips is a very large energy producer with a market value in the large-cap range, which gives it scale advantages in project development, purchasing, and access to capital. The overall picture in the metrics table is mixed in a constructive way: valuation is not especially cheap on simple P/E or price-to-book measures, but cash generation remains strong, profitability is above the sector median, and balance-sheet leverage is clearly lower than many peers. The weaker area is growth quality over a full cycle, especially for earnings, because profits in this industry rise and fall heavily with oil and gas prices rather than compounding smoothly year after year.
Growth
The sector itself is mature rather than fast-growing, so the long-term case does not depend on rapid demand expansion in the same way as software or semiconductors. Oil and gas demand is still supported by transportation, petrochemicals, industrial use, power generation in some regions, and LNG trade growth, but the central question is not whether the sector is expanding quickly. It is whether a producer can keep replacing reserves, adding low-cost barrels, and converting those barrels into durable free cash flow. That is where ConocoPhillips is trying to differentiate itself.
The company’s strategy is built around deepening its position in low-cost-of-supply assets, especially in U.S. shale and advantaged international projects. The major step in recent years was the acquisition of Marathon Oil, which added inventory in the Eagle Ford, Permian, and Bakken. For a long-term view, that deal matters less for headline size than for what it can do to drilling inventory, operating efficiency, and capital flexibility. If integration goes as planned, it should strengthen ConocoPhillips’ ability to maintain production with disciplined spending rather than chase volume at any cost.
Recent revenue growth has been uneven, which is normal for an upstream producer. The latest year-over-year improvement is strong, but the longer pattern shows alternating periods of expansion and contraction as commodity prices moved away from 2022 highs. That makes top-line growth a less reliable signal than cost position and cash generation.
Free cash flow is a more useful measure here, and it remains substantial even after the post-2022 normalization in energy prices. The rebound from the lower levels seen in 2024 and 2025 suggests the business still has strong cash-conversion capacity when pricing and operations are supportive. With nearly $20 billion in trailing free cash flow and a free-cash-flow yield above the sector median, ConocoPhillips retains meaningful room for shareholder distributions, debt management, and project investment.
Another important growth catalyst is LNG exposure. ConocoPhillips has highlighted projects tied to global gas and LNG demand, including Qatar developments and other international opportunities. This matters because LNG demand is expected to grow faster than the broader oil market over the next decade, supported by Asian demand growth and Europe’s efforts to diversify gas supply. For ConocoPhillips, LNG-linked volumes can improve portfolio quality by adding long-life resources and broadening the company beyond U.S. shale.
A further positive factor is the company’s long-running focus on returns rather than pure production growth. In practical terms, that means management appears willing to slow spending when economics weaken and accelerate where returns are stronger. In a cyclical sector, that discipline can be more valuable than simply increasing output.
Risks
This article is for informational purposes only and does not constitute financial advice. Some content is AI-generated. See Disclaimer


