Stock Analysis · The Cooper Companies Inc (COO)
Overview
The Cooper Companies is a healthcare company focused on two specialized areas: contact lenses and women’s health/fertility products and services. It operates through two main divisions, CooperVision and CooperSurgical. CooperVision develops and sells soft contact lenses, including daily disposable, toric lenses for astigmatism, multifocal lenses, and myopia-management products. CooperSurgical sells medical devices, fertility consumables, genomics services, and other products used by obstetricians, gynecologists, and fertility clinics.
Revenue is primarily generated from recurring healthcare demand rather than one-time large equipment sales, which is important for understanding the business model. Based on recent annual reporting, the revenue mix is approximately:
- CooperVision: about 72% of total revenue. This includes daily disposable lenses, reusable spherical lenses, toric lenses, multifocal lenses, and myopia-management lenses.
- CooperSurgical: about 28% of total revenue. This includes fertility clinic products, reproductive health devices, genomics, cryostorage-related offerings, and office/surgical products used in women’s healthcare.
Within that structure, the contact lens business is the main economic engine. It benefits from repeat purchases, broad practitioner relationships, and exposure to vision correction trends that tend to persist over many years. The women’s health segment adds diversification, although it usually carries more integration, reimbursement, and procedure-volume sensitivity than the lens business.
The longer-term financial picture shows a business that has expanded revenue steadily over the past several years, while profitability has been more uneven. Sales rose from just under $3.0 billion in fiscal 2021 to a little above $4.0 billion in fiscal 2025, with gross profit also increasing over that period. Operating income improved meaningfully in fiscal 2024 before easing somewhat in fiscal 2025, suggesting that execution and cost control matter a lot to the next phase of performance.
The revenue progression has been solid, but the profit flow shows some pressure from selling expenses, research spending, and interest costs. In other words, Cooper has grown into a larger healthcare platform, but margin conversion has not moved in a straight line.
Key Figures
| Metric | Value | Sector ⓘ |
|---|---|---|
| Date | Oct 24, 2026 | |
| Context | ||
| Sector | Healthcare | |
| Industry | Medical Instruments & Supplies | |
| Market Cap ⓘ | $11.21B | |
| Beta ⓘ | 0.82 | |
Value (Cheapness) | ||
| P/E Ratio ⓘ | 20.26 | 25.42 |
| P/B Ratio ⓘ | 1.43 | 3.08 |
| FCF Yield ⓘ | 6.05% | 3.12% |
| Dividend Yield ⓘ | N/A | 1.85% |
| EBIT / EV ⓘ | 4.03% | 0.56% |
| PEG ⓘ | 0.52 | |
Growth (Business expansion) | ||
| Revenue Growth ⓘ | 0.60% | 7.50% |
| RPS Growth (5Y CAGR) ⓘ | 8.70% | 8.60% |
| EPS Growth (5Y CAGR) ⓘ | 2.89% | -17.73% |
| BVPS Growth (5Y CAGR) ⓘ | 4.30% | 3.72% |
| Margin Growth (5Y Trend) ⓘ | -2.20% | -0.57% |
| FCF Growth (5Y CAGR) ⓘ | -4.63% | 0.96% |
| DPS Growth (5Y CAGR) ⓘ | N/A | 6.69% |
Quality (Business durability) | ||
| ROIC (Latest) ⓘ | 6.36% | 3.17% |
| ROA (Latest) ⓘ | 4.55% | 2.98% |
| ROIC (5Y Median) ⓘ | 13.85% | 4.56% |
| ROA (5Y Median) ⓘ | 3.27% | 1.87% |
| Net Debt / EBIT (Latest) ⓘ | 4.54 | 1.34 |
| Net Debt / EBIT (5Y Median) ⓘ | 4.24 | 1.86 |
| Net Debt / EBITDA (Latest) ⓘ | 2.62 | 1.00 |
| Net Debt / Assets ⓘ | 18.85% | 5.06% |
| EBITDA / Interest ⓘ | 9.62 | 9.55 |
| Operating Margin (Latest) ⓘ | 12.42% | 9.25% |
| Operating Margin (5Y Median) ⓘ | 16.10% | 7.33% |
| Debt to Equity (Latest) ⓘ | 30.55% | 26.68% |
| Profit Margin (Latest) ⓘ | 13.46% | 3.34% |
| Free Cash Flow (Latest) ⓘ | $678.00M | |
Momentum (Price trend) | ||
| 3Y Return ⓘ | -23.51% | +51.61% |
| 12M Return (excl. last month) ⓘ | -18.69% | +19.90% |
| 6M Return ⓘ | -7.88% | +10.10% |
| Price vs. 200-Day MA ⓘ | -11.39% | +6.44% |
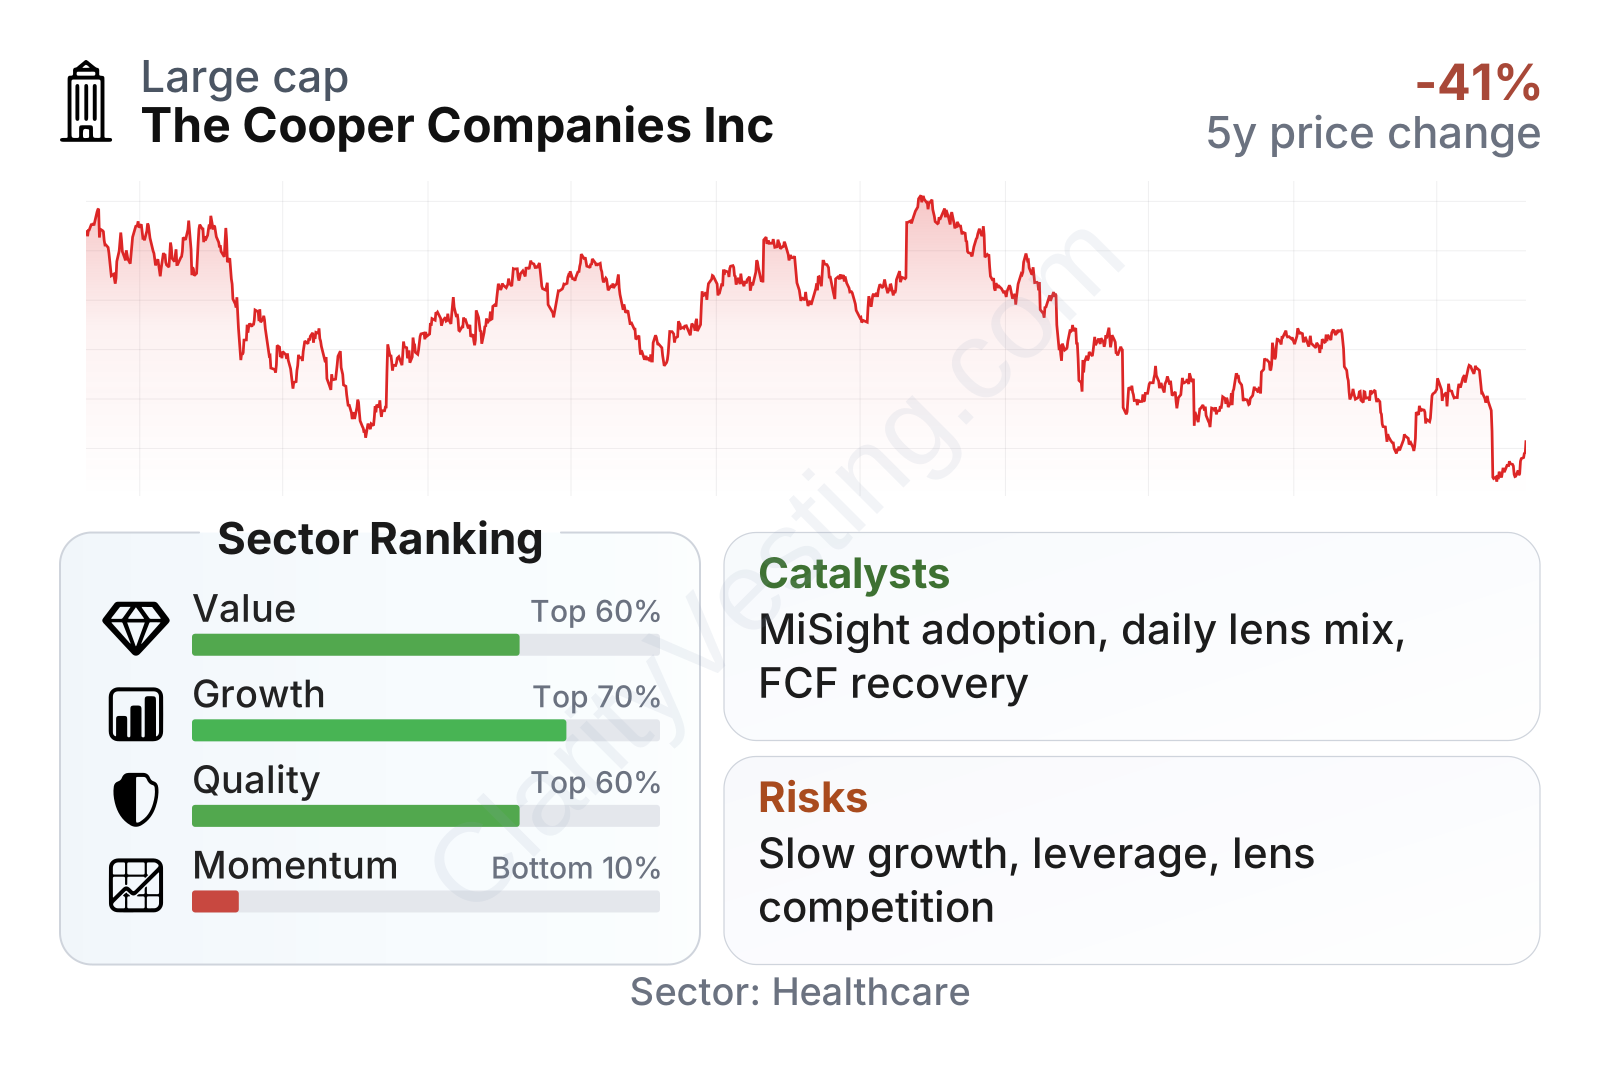
Cooper sits in the large-cap range within medical supplies, with a stock that has historically moved less than the broader market, as suggested by a beta below 1. On valuation and cash generation, the profile looks more favorable than a typical healthcare peer: earnings multiple, book multiple, and free-cash-flow yield all screen better than the sector median. Quality is also respectable, with returns on capital and assets above median levels and profit margin clearly ahead of many peers.
The weaker area is near-term market performance and growth ranking. Recent share-price momentum has lagged badly, and the latest year-over-year revenue growth slowed to a very low level versus the broader healthcare group. This combination often means the market is waiting for clearer evidence that growth can reaccelerate and that margins can remain durable.
Growth
Cooper operates in parts of healthcare that have favorable long-term demand drivers. In vision care, the need for contact lenses is supported by population growth, rising myopia rates, product upgrades toward daily disposables, and growing demand for specialty lenses such as toric and multifocal products. In women’s health, fertility treatment volumes and reproductive health needs can benefit from delayed childbearing, greater treatment access, and ongoing clinic investment. These are not short-lived themes.
Its strategy is also reasonably easy to understand. CooperVision continues pushing higher-value categories, especially daily disposable lenses and myopia management. That matters because these categories can support stronger pricing and customer retention than more commoditized lens products. CooperSurgical gives the company a second avenue for expansion through fertility and women’s health, where procedure growth and cross-selling across clinics can support incremental revenue.
Revenue growth has been healthy over most of the past several years, generally running in the mid-single-digit to low-double-digit range, but the most recent reading dropped close to flat. That slowdown does not erase the broader growth record, yet it does make the next few quarters important. For a company positioned in structurally attractive niches, weak recent growth raises the question of whether the softness is temporary or a sign of tougher competition and slower end-market demand.
Cash generation has also recovered after a weaker stretch. Trailing free cash flow is now around the high-hundreds-of-millions level, and the trend since early 2024 has improved materially. That recovery matters because healthcare manufacturers with recurring products and strong distribution typically gain strategic flexibility when cash flow normalizes: they can invest in manufacturing, support product launches, reduce debt, or pursue selective acquisitions.
A meaningful catalyst for Cooper is continued adoption of premium contact lenses, especially in myopia management. Myopia in children is becoming a larger clinical focus globally, and CooperVision’s MiSight product family gives the company exposure to a category that could expand for years if practitioner adoption and regulatory support continue. Another catalyst is margin improvement if manufacturing efficiency and product mix shift further toward higher-value lenses.
Recent company updates have also highlighted ongoing product innovation and capacity investments in vision care, which supports the idea that management is still building for long-term category growth rather than simply defending existing share.
Risks
This article is for informational purposes only and does not constitute financial advice. Some content is AI-generated. See Disclaimer


