Stock Analysis · Capital One Financial Corporation (COF)
Overview
Capital One Financial Corporation is a large U.S. consumer finance company that combines a national bank with a major credit card franchise. It is best known for credit cards, but it also provides auto loans, consumer banking, commercial banking, and digital banking services. The business model is straightforward: Capital One collects deposits, lends money, earns interest on those loans, and also generates fee income from card usage and banking services.
The company reports its business through three main operating segments. Based on recent annual reporting, revenue is led by credit cards by a wide margin, followed by consumer banking and then commercial banking.
- Credit Card: about 60% to 70% of total revenue. This includes interest income on credit card balances, interchange fees from card spending, and certain account-related fees. This is the core engine of the company and the main reason results can be both highly profitable and more cyclical than a traditional bank.
- Consumer Banking: about 20% to 30% of total revenue. This segment includes auto lending, retail banking, and direct banking. It earns money mainly from interest on auto and consumer loans, along with spread income from deposits and other banking products.
- Commercial Banking: about 10% to 15% of total revenue. This includes lending, treasury management, and deposit services for commercial clients in sectors such as real estate and middle-market businesses.
One important feature of Capital One is that it is not just a lender; it also has a large deposit base. That matters because deposits are usually a cheaper and steadier source of funding than relying heavily on wholesale markets. It also helps explain why the company has spent years building a national digital bank alongside its card business.
Revenue has expanded strongly over the last several years, but profitability has been less steady. Total revenue rose from roughly $32 billion in 2021 to more than $69 billion in 2025, while net income moved in the opposite direction, falling from about $12.4 billion to about $2.5 billion over the same period. That gap points to the central issue with Capital One: growth in lending and balances can be impressive, but credit costs, funding costs, and operating expenses can change the final outcome sharply.
The long-term pattern shows a business with rising revenue but heavier expense pressure. Interest expense and operating costs have taken a much larger share of revenue than they did a few years ago, which helps explain why profit conversion has weakened despite top-line expansion.
Key Figures
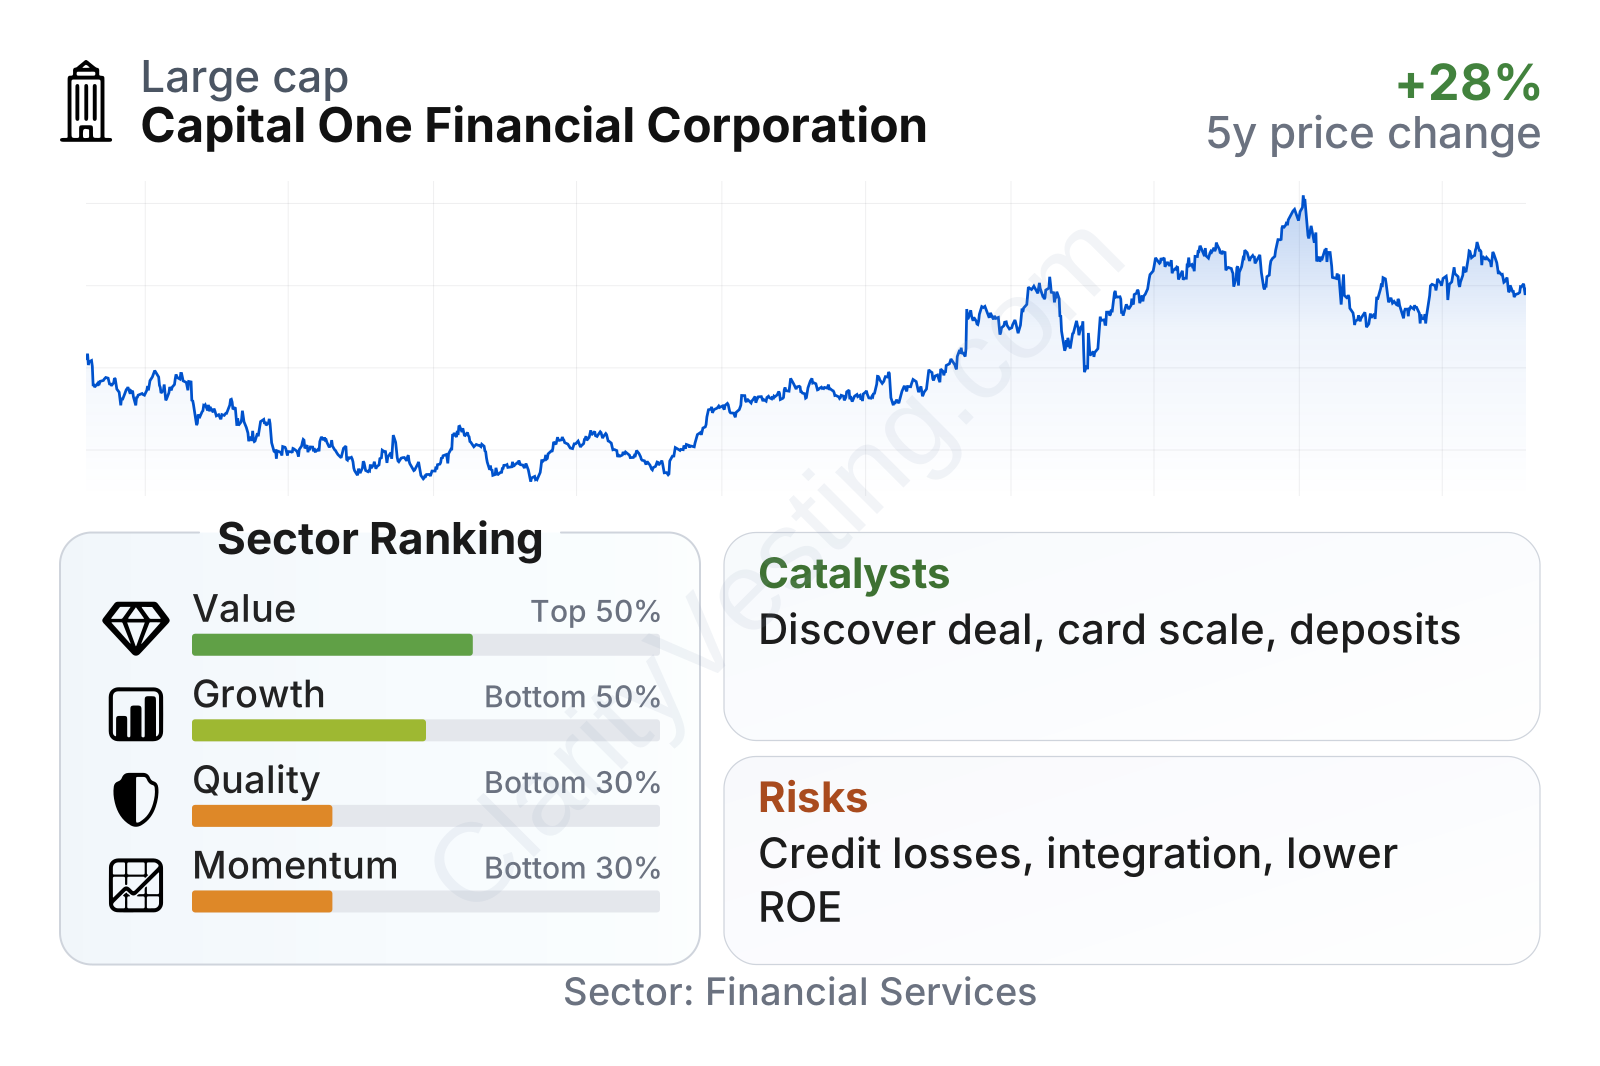
The share price has been volatile, which is common for lenders tied to consumer credit. After dropping hard in 2022, the stock recovered strongly through 2024 and into early 2026, then pulled back. That kind of movement reflects how quickly market views can change when investors reassess credit quality, interest rates, and earnings durability.
| Metric | Value | Sector ⓘ |
|---|---|---|
| Date | Oct 17, 2026 | |
| Context | ||
| Sector | Financial Services | |
| Industry | Credit Services | |
| Market Cap ⓘ | $119.23B | |
| Beta ⓘ | 1.04 | |
Value (Cheapness) | ||
| P/E Ratio ⓘ | 12.48 | 12.26 |
| P/B Ratio ⓘ | 1.09 | 1.23 |
| FCF Yield ⓘ | 27.01% | 10.40% |
| Dividend Yield ⓘ | 1.51% | 3.02% |
| EBIT / EV ⓘ | 13.50% | 8.14% |
| PEG ⓘ | 0.18 | |
Growth (Business expansion) | ||
| Revenue Growth ⓘ | 1111.00% | 9.35% |
| RPS Growth (5Y CAGR) ⓘ | 15.41% | 12.19% |
| EPS Growth (5Y CAGR) ⓘ | -13.48% | -9.53% |
| BVPS Growth (5Y CAGR) ⓘ | 11.18% | 4.99% |
| Margin Growth (5Y Trend) ⓘ | -46.06% | -3.86% |
| FCF Growth (5Y CAGR) ⓘ | 22.49% | 4.81% |
| DPS Growth (5Y CAGR) ⓘ | 0.50% | 8.79% |
Quality (Business durability) | ||
| ROIC (Latest) ⓘ | 7.95% | 9.49% |
| ROE (Latest) ⓘ | 9.08% | 13.90% |
| ROA (Latest) ⓘ | 1.58% | 1.55% |
| ROIC (5Y Median) ⓘ | 4.70% | 7.86% |
| ROE (5Y Median) ⓘ | 8.28% | 12.17% |
| ROA (5Y Median) ⓘ | 1.05% | 1.30% |
| Net Debt / EBIT (Latest) ⓘ | -0.57 | 0.96 |
| Net Debt / EBIT (5Y Median) ⓘ | 1.09 | 0.73 |
| Net Debt / EBITDA (Latest) ⓘ | -0.41 | 0.92 |
| Operating Margin (Latest) ⓘ | 21.02% | 22.30% |
| Operating Margin (5Y Median) ⓘ | 12.22% | 24.63% |
| Debt to Equity (Latest) ⓘ | 39.87% | 58.56% |
| Profit Margin (Latest) ⓘ | 21.87% | 26.57% |
| Free Cash Flow (Latest) ⓘ | $32.20B | |
Momentum (Price trend) | ||
| 3Y Return ⓘ | +114.42% | +88.33% |
| 12M Return (excl. last month) ⓘ | -7.27% | +19.38% |
| 6M Return ⓘ | -1.26% | +4.75% |
| Price vs. 200-Day MA ⓘ | -1.74% | +3.50% |
Capital One currently screens as relatively inexpensive on earnings and book value compared with the sector median, while cash generation looks unusually strong. At the same time, quality and momentum rank weaker than value. In plain terms, the market is not assigning a premium multiple to the business, likely because profitability has been less consistent and returns on capital have trailed many peers.
The company is very large, with a market value above $100 billion, and its beta sits near 1.0, suggesting the stock has broadly moved in line with the market rather than acting as an extreme outlier. The dividend yield is modest at around 1.5%, so the equity case is more tied to earnings power and book value growth than to income.
Growth
Capital One operates in a sector with durable long-term demand. Credit cards remain one of the most profitable areas of consumer finance, and digital banking continues to gain share as customers shift away from branch-heavy models. In that sense, the company is positioned in two attractive areas at once: unsecured consumer lending and technology-enabled banking.
Its strategy is coherent for future growth. Capital One has long emphasized data-driven underwriting, national scale, and a digital-first banking platform. That combination can support customer acquisition, cross-selling, and operating leverage over time. The company is especially strong in mass-market and prime credit card lending, where scale, risk analytics, and marketing efficiency matter. If funding remains stable and credit performance normalizes, that structure can translate into improving earnings power.
A major catalyst is the proposed acquisition of Discover. Strategically, that deal could be meaningful because it would not only add loan balances and customers, but also give Capital One stronger control over payments infrastructure through Discover’s network. That could improve economics on card transactions over time, strengthen scale against the largest card issuers, and broaden the company’s role across the payments value chain. Integration execution will matter, but the industrial logic is easy to see.
Recent business trends also show some encouraging elements beneath the noise. Revenue growth has been healthy, with year-over-year revenue growth above 11%, and book value per share has compounded at a double-digit pace over five years, clearly ahead of the sector median. That suggests the company has continued building balance sheet value even through a difficult credit cycle.
Earnings per share have been uneven rather than linear. EPS fell sharply from the unusually strong post-pandemic period, then partially recovered. That pattern fits a lender moving through changing credit costs and funding conditions, not a structurally broken franchise. The key question is whether earnings can settle at a higher and more stable base once current pressures ease.
Book value per share has moved upward over time, and the rise into 2025 was especially notable. For banks and card issuers, book value is an important anchor because it reflects the capital base supporting future lending and earnings. Sustained growth here is a favorable sign, particularly when the stock trades close to book value rather than at a large premium.
Risks
This article is for informational purposes only and does not constitute financial advice. Some content is AI-generated. See Disclaimer


