Stock Analysis · CNX Resources Corp (CNX)
Overview
CNX Resources is a U.S. natural gas producer focused mainly on the Appalachian Basin, especially the Marcellus and Utica shale areas in Pennsylvania, Ohio, and West Virginia. In simple terms, the company drills wells, produces natural gas, and sells that gas and related products into energy markets. It also owns midstream and water-related infrastructure that supports its operations, which helps it move product and manage costs more efficiently than a producer that depends more heavily on third parties.
Its business is still centered on natural gas, but reported revenue can move sharply from year to year because energy prices are volatile and because CNX uses hedging and other financial contracts that can create large accounting swings. That means headline revenue and profit can sometimes look unusually strong or weak compared with the underlying production business.
The main sources of revenue are broadly the following:
- Natural gas sales: the largest source by a wide margin, generally the clear majority of operating revenue. This includes gas produced from CNX’s Appalachian wells and sold to customers and market hubs.
- Natural gas liquids and oil sales: a smaller contribution than dry gas, but still part of total upstream revenue where applicable.
- Midstream and other operating revenue: gathering, water, and related infrastructure services tied to the company’s production system; typically a modest share compared with commodity sales.
- Risk-management and other items: gains or losses on derivatives can materially affect reported revenue in some periods, even though they are not the same as physical production growth.
For a practical long-term view, CNX is best understood as a natural-gas-focused exploration and production company with an unusually strong emphasis on operational control, cost discipline, emissions management, and shareholder returns through cash generation.
Over the last several years, the company’s earnings path has been far from smooth, but one pattern stands out: cash generation has remained more resilient than revenue alone suggests. Revenue and net income have swung sharply with commodity prices and hedging effects, while operating expenses have been comparatively controlled.
Key Figures
| Metric | Value | Sector ⓘ |
|---|---|---|
| Date | Oct 17, 2026 | |
| Context | ||
| Sector | Energy | |
| Industry | Oil & Gas E&P | |
| Market Cap ⓘ | $5.23B | |
| Beta ⓘ | 0.69 | |
Value (Cheapness) | ||
| P/E Ratio ⓘ | 5.72 | 15.44 |
| P/B Ratio ⓘ | 1.11 | 1.73 |
| FCF Yield ⓘ | 10.06% | 8.20% |
| Dividend Yield ⓘ | N/A | 3.59% |
| EBIT / EV ⓘ | 18.19% | 7.46% |
| PEG ⓘ | 1.93 | |
Growth (Business expansion) | ||
| Revenue Growth ⓘ | -18.10% | 26.90% |
| RPS Growth (5Y CAGR) ⓘ | 4.83% | 6.90% |
| EPS Growth (5Y CAGR) ⓘ | -7.42% | -15.73% |
| BVPS Growth (5Y CAGR) ⓘ | 12.09% | 6.07% |
| Margin Growth (5Y Trend) ⓘ | 65.75% | 0.58% |
| FCF Growth (5Y CAGR) ⓘ | 3.77% | 1.86% |
| DPS Growth (5Y CAGR) ⓘ | 17.97% | 16.79% |
Quality (Business durability) | ||
| ROIC (Latest) ⓘ | 15.76% | 11.40% |
| ROA (Latest) ⓘ | 10.53% | 6.06% |
| ROIC (5Y Median) ⓘ | 0.37% | 10.30% |
| ROA (5Y Median) ⓘ | -1.06% | 5.42% |
| Net Debt / EBIT (Latest) ⓘ | 1.77 | 1.64 |
| Net Debt / EBIT (5Y Median) ⓘ | 2.52 | 1.83 |
| Net Debt / EBITDA (Latest) ⓘ | 1.24 | 1.08 |
| Net Debt / Assets ⓘ | 25.61% | 17.29% |
| EBITDA / Interest ⓘ | 11.46 | 9.64 |
| Operating Margin (Latest) ⓘ | 55.19% | 16.27% |
| Operating Margin (5Y Median) ⓘ | 2.10% | 20.39% |
| Debt to Equity (Latest) ⓘ | 49.14% | 54.76% |
| Profit Margin (Latest) ⓘ | 44.37% | 8.82% |
| Free Cash Flow (Latest) ⓘ | $525.98M | |
Momentum (Price trend) | ||
| 3Y Return ⓘ | +50.28% | +67.38% |
| 12M Return (excl. last month) ⓘ | +17.95% | +49.19% |
| 6M Return ⓘ | -9.25% | +7.07% |
| Price vs. 200-Day MA ⓘ | -4.34% | +9.56% |
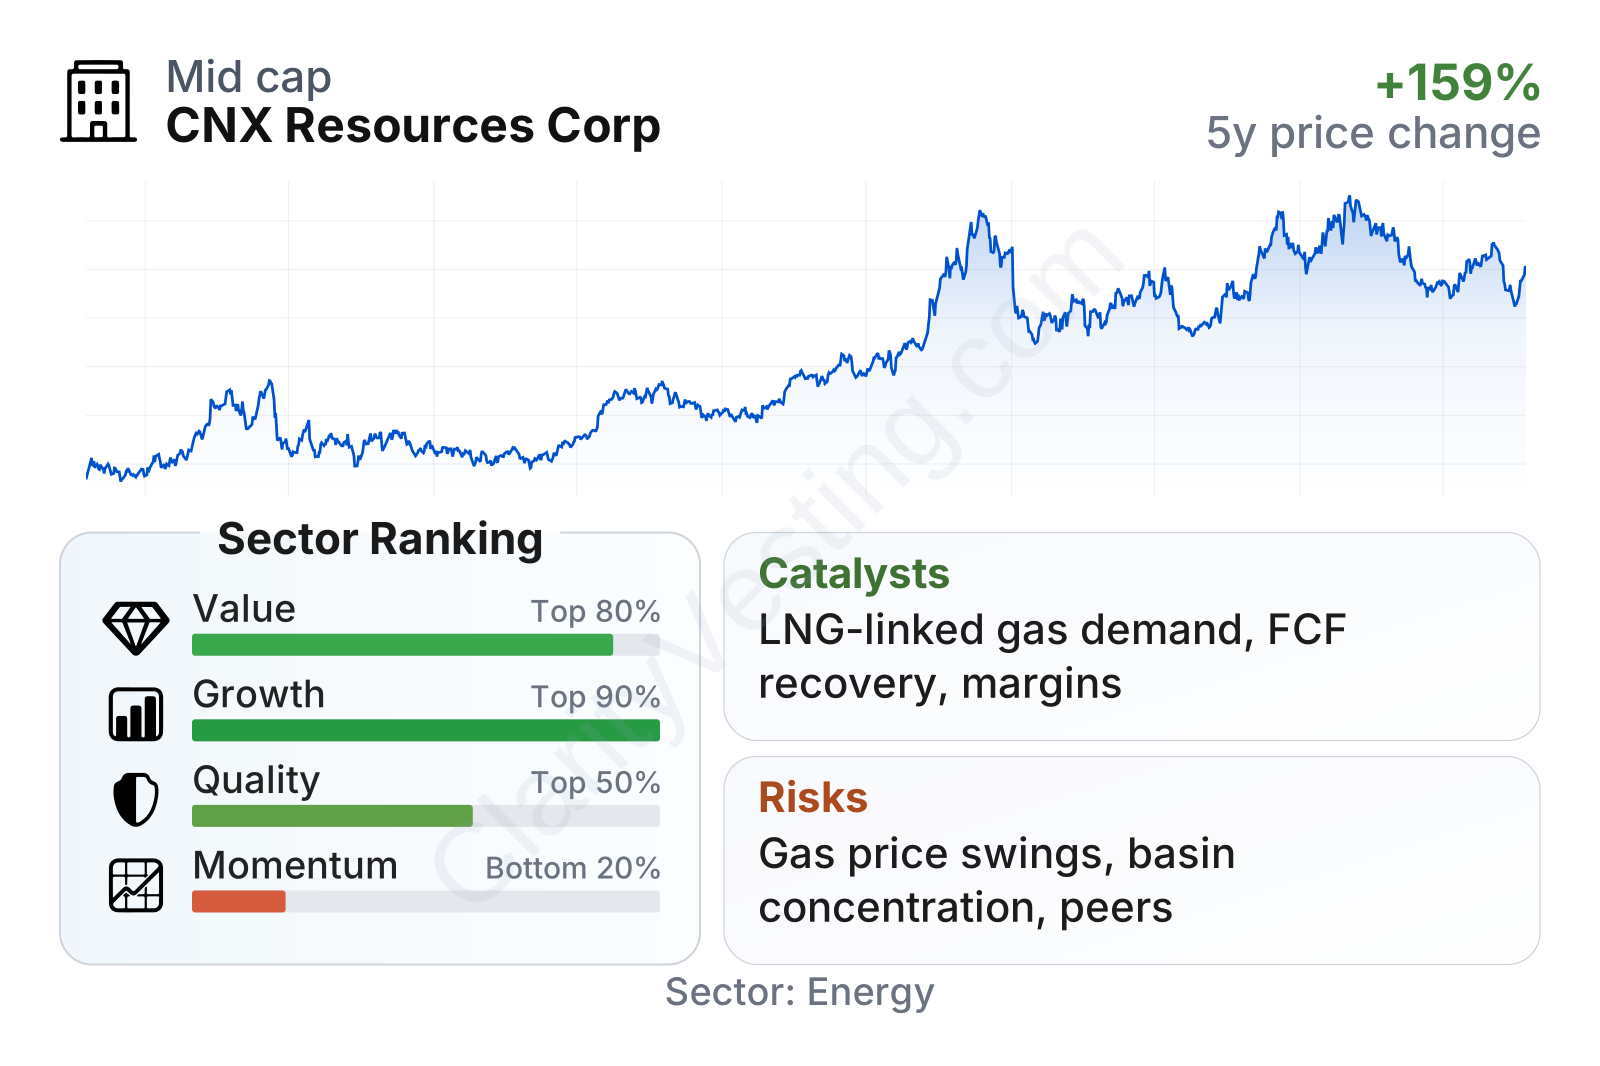
CNX currently screens as strong on value and above average on quality, while share-price momentum is weak relative to the broader energy group. Profitability and returns on capital are currently well above sector medians, and free cash flow remains meaningful for a company of its size. The weaker area is recent growth consistency, because revenue has been volatile and the market has recently marked the shares down from their highs.
The stock’s trading pattern over the last few years shows a strong rise from 2021 through early 2026, followed by a noticeable pullback. That kind of move is common in commodity-linked businesses: sentiment can shift quickly when gas prices, hedging expectations, or near-term production assumptions change.
Growth
CNX operates in a sector that should remain relevant for years, even if it is not a classic high-growth industry. Natural gas continues to play an important role in U.S. power generation, industrial demand, LNG exports, and as a balancing fuel alongside renewable energy. That backdrop supports the idea that low-cost gas producers with long reserve life and disciplined capital spending can still create value over long periods.
CNX’s strategy is relatively straightforward and makes sense for this industry. Management has focused on keeping capital allocation tight, improving well productivity, using infrastructure it already controls, and maintaining a hedge book to reduce some commodity-price risk. The company has also spent years building an environmental positioning around methane management, certified gas, and lower-emission operations. That may not transform demand overnight, but it can help with customers, regulators, and market access.
Recent revenue growth has rebounded after a very weak stretch in 2023 and parts of 2024. The business moved from steep year-over-year declines to clearly positive growth through 2025 and remained positive into 2026, although the pace has cooled from the strongest rebound quarters. That pattern suggests the worst of the downcycle passed, but it also shows how dependent top-line growth remains on commodity conditions rather than on steady volume expansion alone.
Free cash flow is one of the more encouraging parts of the CNX profile. After dropping sharply during a weaker period, trailing cash generation recovered back into the several-hundred-million-dollar range by 2026. For a company with a market value in the mid-single-digit billions, that is a meaningful result and helps explain why valuation measures tied to cash and operating earnings look favorable.
A key catalyst is U.S. natural gas demand growth tied to LNG export capacity, power demand, and industrial use. CNX is also positioned in one of North America’s most important gas basins, which gives it relevance if regional takeaway and long-term gas demand continue to expand. Another positive factor is that the company has recently shown strong operating margins and healthy returns on invested capital, indicating that its cost structure can work well when pricing is supportive.
Recent company updates have also continued to emphasize disciplined development, operational efficiency, and emissions-related initiatives. Those are not dramatic one-time events, but for a long-term analysis they matter because they reinforce a model built around repeatable cash generation rather than aggressive production growth at any cost.
Risks
This article is for informational purposes only and does not constitute financial advice. Some content is AI-generated. See Disclaimer


