Stock Analysis · Vicinity Centres (CNRAF)
Overview
Vicinity Centres is an Australian retail real estate investment trust focused on owning, managing, and developing shopping centers. Its portfolio is concentrated in major urban and suburban trade areas, with a strong presence in premium destinations and large mixed-use retail assets. For long-term analysis, the key point is that this is not a conventional retailer: it earns money primarily from renting space to retailers, service providers, and other occupiers, while also benefiting from property management, development activity, and changes in property valuations.
The business is built around physical retail locations that aim to remain relevant by combining everyday needs, fashion, dining, entertainment, and services. That matters because the strongest mall owners tend to be those with well-located assets, dense catchment areas, and the ability to refresh tenant mixes over time.
Based on the company’s reporting structure and the economics of retail REITs, Vicinity’s main revenue sources are broadly the following:
- Rental and occupancy income: roughly 80% to 90% of recurring operating revenue. This includes base rent from specialty stores, anchor tenants, kiosks, and other leasing arrangements across its shopping center portfolio.
- Recoveries and property-related income: roughly 10% to 15%. This usually includes outgoings recovered from tenants, parking, casual mall leasing, media, and other center-based income streams.
- Funds management, development, and other income: typically a small share of revenue, though development profits and valuation gains can materially affect accounting earnings in some periods.
What stands out in recent years is that total revenue has moved upward at a steady pace, while operating income and net income have been much more volatile because property revaluations and similar non-cash items can swing reported profit. For a REIT, cash generation, occupancy quality, leasing spreads, and balance sheet discipline are often more informative than headline profit alone.
The profit flow shows a business with gradually rising revenue and gross profit over several years, while interest expense has also climbed. Recent earnings improved sharply, but part of that strength likely reflects property valuation movements rather than pure rent growth, so recurring operating trends remain the more important long-term anchor.
Key Figures
| Metric | Value | Sector ⓘ |
|---|---|---|
| Date | Oct 17, 2026 | |
| Context | ||
| Sector | Real Estate | |
| Industry | REIT - Retail | |
| Market Cap ⓘ | $5.90B | |
| Beta ⓘ | 0.79 | |
Value (Cheapness) | ||
| P/E Ratio ⓘ | 6.30 | 17.38 |
| P/B Ratio ⓘ | 0.44 | 0.85 |
| FCF Yield ⓘ | 11.40% | 7.38% |
| Dividend Yield ⓘ | 8.56% | 4.85% |
| EBIT / EV ⓘ | N/A | 3.78% |
| PEG ⓘ | N/A | |
Growth (Business expansion) | ||
| Revenue Growth ⓘ | 3.60% | 5.30% |
| RPS Growth (5Y CAGR) ⓘ | 13.29% | 6.02% |
| EPS Growth (5Y CAGR) ⓘ | N/A | -11.37% |
| BVPS Growth (5Y CAGR) ⓘ | 12.32% | 0.45% |
| Margin Growth (5Y Trend) ⓘ | 52.59% | -0.22% |
| FCF Growth (5Y CAGR) ⓘ | N/A | 5.40% |
| DPS Growth (5Y CAGR) ⓘ | 0.63% | 5.02% |
Quality (Business durability) | ||
| ROIC (Latest) ⓘ | N/A | 5.69% |
| ROE (Latest) ⓘ | 20.83% | 7.56% |
| ROA (Latest) ⓘ | 14.14% | 2.85% |
| ROIC (5Y Median) ⓘ | 7.94% | 4.22% |
| ROE (5Y Median) ⓘ | 9.23% | 6.03% |
| ROA (5Y Median) ⓘ | 6.27% | 2.44% |
| Net Debt / EBIT (Latest) ⓘ | 1.97 | 7.59 |
| Net Debt / EBIT (5Y Median) ⓘ | 3.97 | 8.40 |
| Net Debt / EBITDA (Latest) ⓘ | 1.96 | 5.27 |
| Net Debt / Assets ⓘ | 27.88% | 37.76% |
| EBITDA / Interest ⓘ | 5.87 | 4.10 |
| Operating Margin (Latest) ⓘ | 90.78% | 35.29% |
| Operating Margin (5Y Median) ⓘ | 65.98% | 37.31% |
| Debt to Equity (Latest) ⓘ | 40.79% | 88.87% |
| Profit Margin (Latest) ⓘ | 98.49% | 19.61% |
| Free Cash Flow (Latest) ⓘ | $672.23M | |
Momentum (Price trend) | ||
| 3Y Return ⓘ | +78.03% | +30.75% |
| 12M Return (excl. last month) ⓘ | +24.60% | +4.36% |
| 6M Return ⓘ | -7.04% | -2.52% |
| Price vs. 200-Day MA ⓘ | +32.30% | -2.34% |
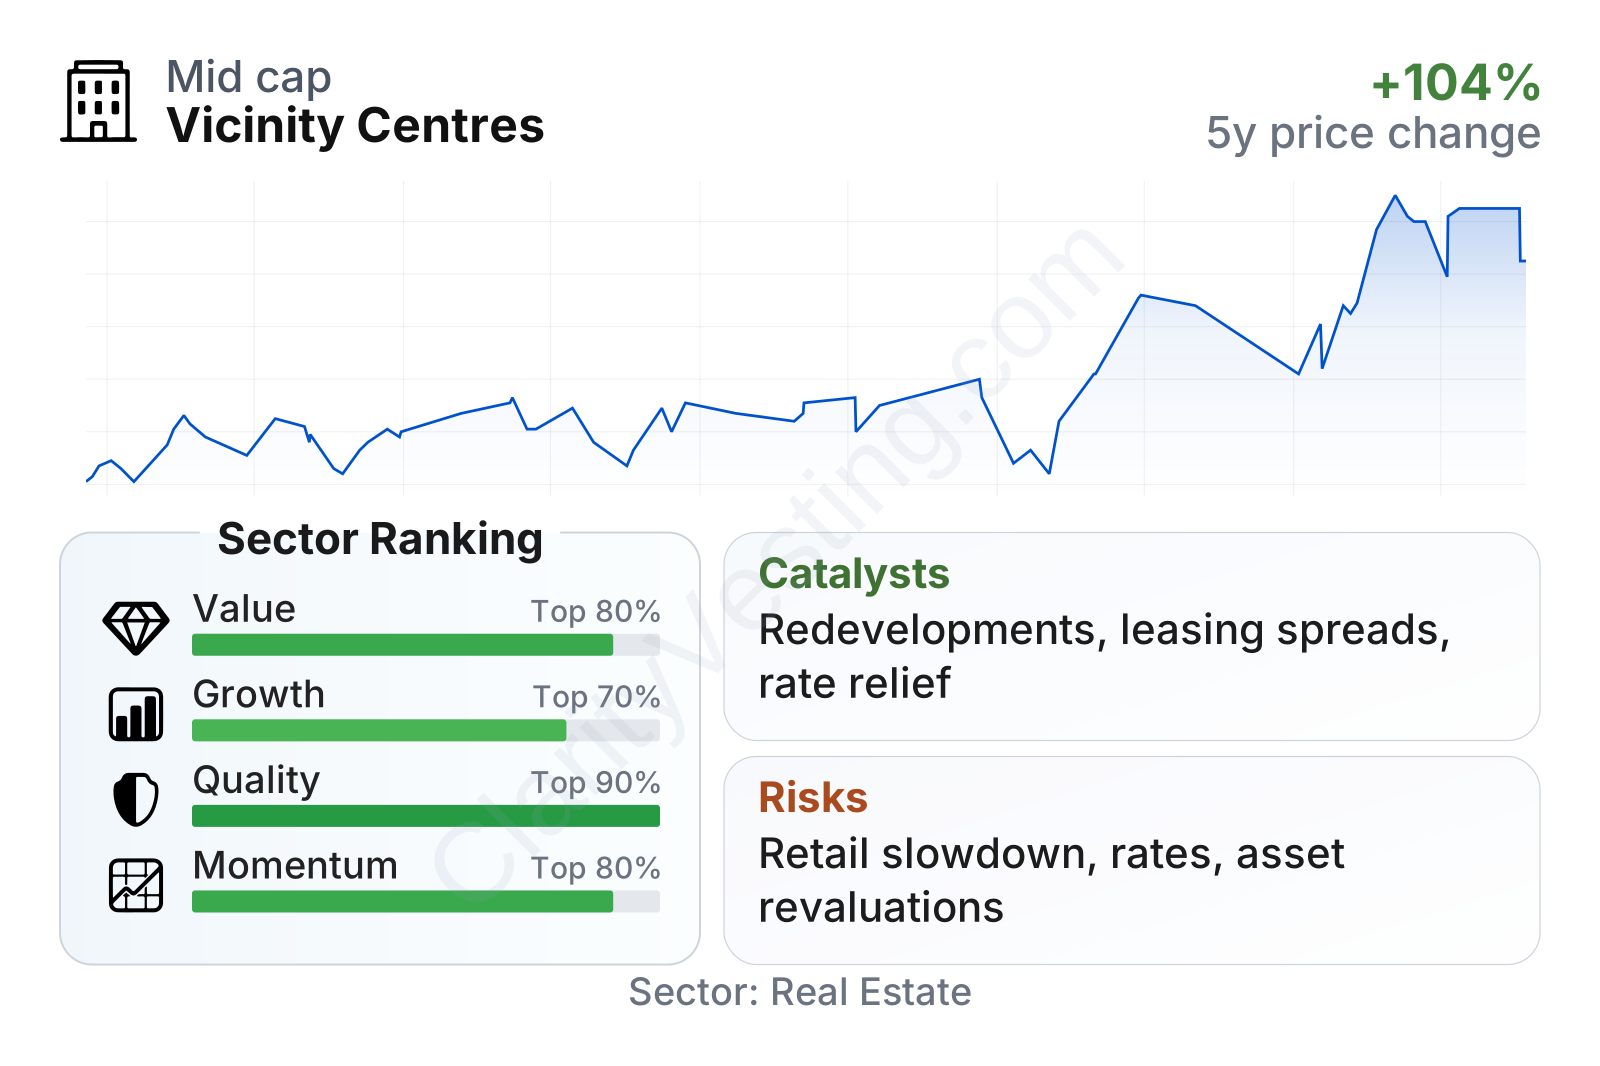
Vicinity scores well on quality, momentum, and income-related valuation measures relative to much of the real estate sector. Profitability and returns on assets and equity are notably ahead of sector medians, while leverage looks more controlled than many peers. Growth is positive rather than explosive, with revenue expansion modest on a one-year view but stronger over a five-year per-share basis. The stock’s recent market performance has also been much stronger than the sector median, which suggests sentiment has improved meaningfully.
The company is mid-sized by listed real estate standards and has shown relatively low share-price volatility, with a beta below 1. That combination can appeal to readers looking at stability, although lower volatility does not remove the underlying exposure to property values, tenant health, and interest rates.
Growth
Vicinity operates in a sector that is no longer viewed as a broad high-growth area, but the outlook is more nuanced than the simple “e-commerce versus malls” narrative. High-quality shopping centers in dense locations have remained relevant because they serve functions that online retail cannot fully replace: convenience, social activity, food, services, health, and brand visibility. In that sense, the company is positioned in a mature sector with selective growth opportunities rather than in a structurally fast-growing industry.
Its strategy makes sense if execution remains strong. The company has focused on premium and productive retail assets, active leasing, redevelopment, and mixed-use optionality. For a landlord like Vicinity, growth can come from several levers at once: rental uplifts, occupancy improvement, redevelopment of existing sites, and extracting more value from land already under control. This is often more attractive than relying on expensive acquisitions.
Revenue per share has trended upward over the last five years and then accelerated in the most recent period. That matters because it suggests growth has not only come from asset revaluations on paper, but also from stronger income generation relative to the share count. The long-term increase compares favorably with much of the sector.
Dividends per share have been comparatively stable, with only limited growth over five years. That points to a company prioritizing consistency over aggressive payout expansion. For a retail REIT, stable distributions can still be meaningful, but the pattern also shows that rising operating performance has not fully translated into rapid dividend growth.
Potential catalysts are practical rather than speculative. Redevelopment projects, better tenant sales productivity, occupancy gains, and stronger leasing spreads could support future income. Another important catalyst is the interest-rate backdrop: if financing conditions become less restrictive, property valuations and transaction activity across listed real estate could improve. Recent operating momentum and strong share-price performance suggest the market has already started to recognize some of that improvement.
Risks
This article is for informational purposes only and does not constitute financial advice. Some content is AI-generated. See Disclaimer


