Stock Analysis · CenterPoint Energy Inc (CNP)
Overview
CenterPoint Energy is a regulated utility company. In simple terms, it owns and operates essential energy networks that deliver electricity and natural gas to homes and businesses. Its operations are concentrated mainly in Texas, Indiana, Ohio, Louisiana, Minnesota, Mississippi, and a few neighboring areas. Because most of its business is regulated, its earnings are shaped less by short-term swings in consumer demand and more by infrastructure investment plans, customer growth, and utility rate decisions approved by state regulators.
The company’s revenue comes from two main utility activities. Based on recent annual reporting, electric operations are the largest contributor, while natural gas distribution remains a major second pillar. The exact mix can move from year to year because weather, fuel recovery, and regulatory timing affect reported sales, but the business can be summarized as follows:
- Electric utility: approximately 55% to 65% of revenue. This includes electricity transmission and distribution, especially in the Houston area and Indiana, plus related charges passed through customer bills.
- Natural gas utility: approximately 35% to 45% of revenue. This includes local gas distribution service to residential, commercial, and industrial customers across multiple states.
One useful point for long-term readers is that reported revenue is not always the best measure of business quality for a regulated utility. A meaningful share of customer billings can reflect fuel and purchased power costs that are passed through rather than kept as profit. That is why operating income, allowed returns on invested capital, and the growth of the regulated asset base often matter more than top-line sales alone.
Over the last several years, the business mix has also become more centered on regulated operations after portfolio simplification. That generally makes the company easier to understand: fewer non-core businesses, more focus on wires, pipes, grid reliability, and steady customer service.
The long-term pattern shows a fairly stable revenue base, but profitability has been influenced by rising interest expense and changing input costs. Operating income has held up better than reported gross profit in recent years, which is consistent with a utility that benefits from regulated infrastructure earnings even when cost flows move around.
Key Figures
| Metric | Value | Sector ⓘ |
|---|---|---|
| Date | Oct 17, 2026 | |
| Context | ||
| Sector | Utilities | |
| Industry | Utilities - Regulated Electric | |
| Market Cap ⓘ | $25.93B | |
| Beta ⓘ | 0.46 | |
Value (Cheapness) | ||
| P/E Ratio ⓘ | 23.29 | 17.28 |
| P/B Ratio ⓘ | 2.25 | 1.51 |
| FCF Yield ⓘ | -10.39% | 0.65% |
| Dividend Yield ⓘ | 2.31% | 3.77% |
| EBIT / EV ⓘ | 4.83% | 5.01% |
| PEG ⓘ | 1.62 | |
Growth (Business expansion) | ||
| Revenue Growth ⓘ | 10.70% | 6.10% |
| RPS Growth (5Y CAGR) ⓘ | 1.03% | 3.87% |
| EPS Growth (5Y CAGR) ⓘ | -9.23% | -11.30% |
| BVPS Growth (5Y CAGR) ⓘ | 4.71% | 4.23% |
| Margin Growth (5Y Trend) ⓘ | 7.33% | 3.57% |
| FCF Growth (5Y CAGR) ⓘ | -6.67% | -8.84% |
| DPS Growth (5Y CAGR) ⓘ | 2.05% | 4.84% |
Quality (Business durability) | ||
| ROIC (Latest) ⓘ | 5.69% | 6.53% |
| ROA (Latest) ⓘ | 2.39% | 3.20% |
| ROIC (5Y Median) ⓘ | 5.55% | 5.95% |
| ROA (5Y Median) ⓘ | 2.44% | 2.75% |
| Net Debt / EBIT (Latest) ⓘ | 10.65 | 7.13 |
| Net Debt / EBIT (5Y Median) ⓘ | 10.36 | 7.23 |
| Net Debt / EBITDA (Latest) ⓘ | 6.23 | 4.31 |
| Net Debt / Assets ⓘ | 51.86% | 38.42% |
| EBITDA / Interest ⓘ | 3.97 | 4.58 |
| Operating Margin (Latest) ⓘ | 24.42% | 20.83% |
| Operating Margin (5Y Median) ⓘ | 20.82% | 20.08% |
| Debt to Equity (Latest) ⓘ | 214.10% | 137.69% |
| Profit Margin (Latest) ⓘ | 11.61% | 11.37% |
| Free Cash Flow (Latest) ⓘ | -$2.69B | |
Momentum (Price trend) | ||
| 3Y Return ⓘ | +55.37% | +52.37% |
| 12M Return (excl. last month) ⓘ | +3.37% | +8.84% |
| 6M Return ⓘ | -6.44% | -3.95% |
| Price vs. 200-Day MA ⓘ | -3.36% | -0.79% |
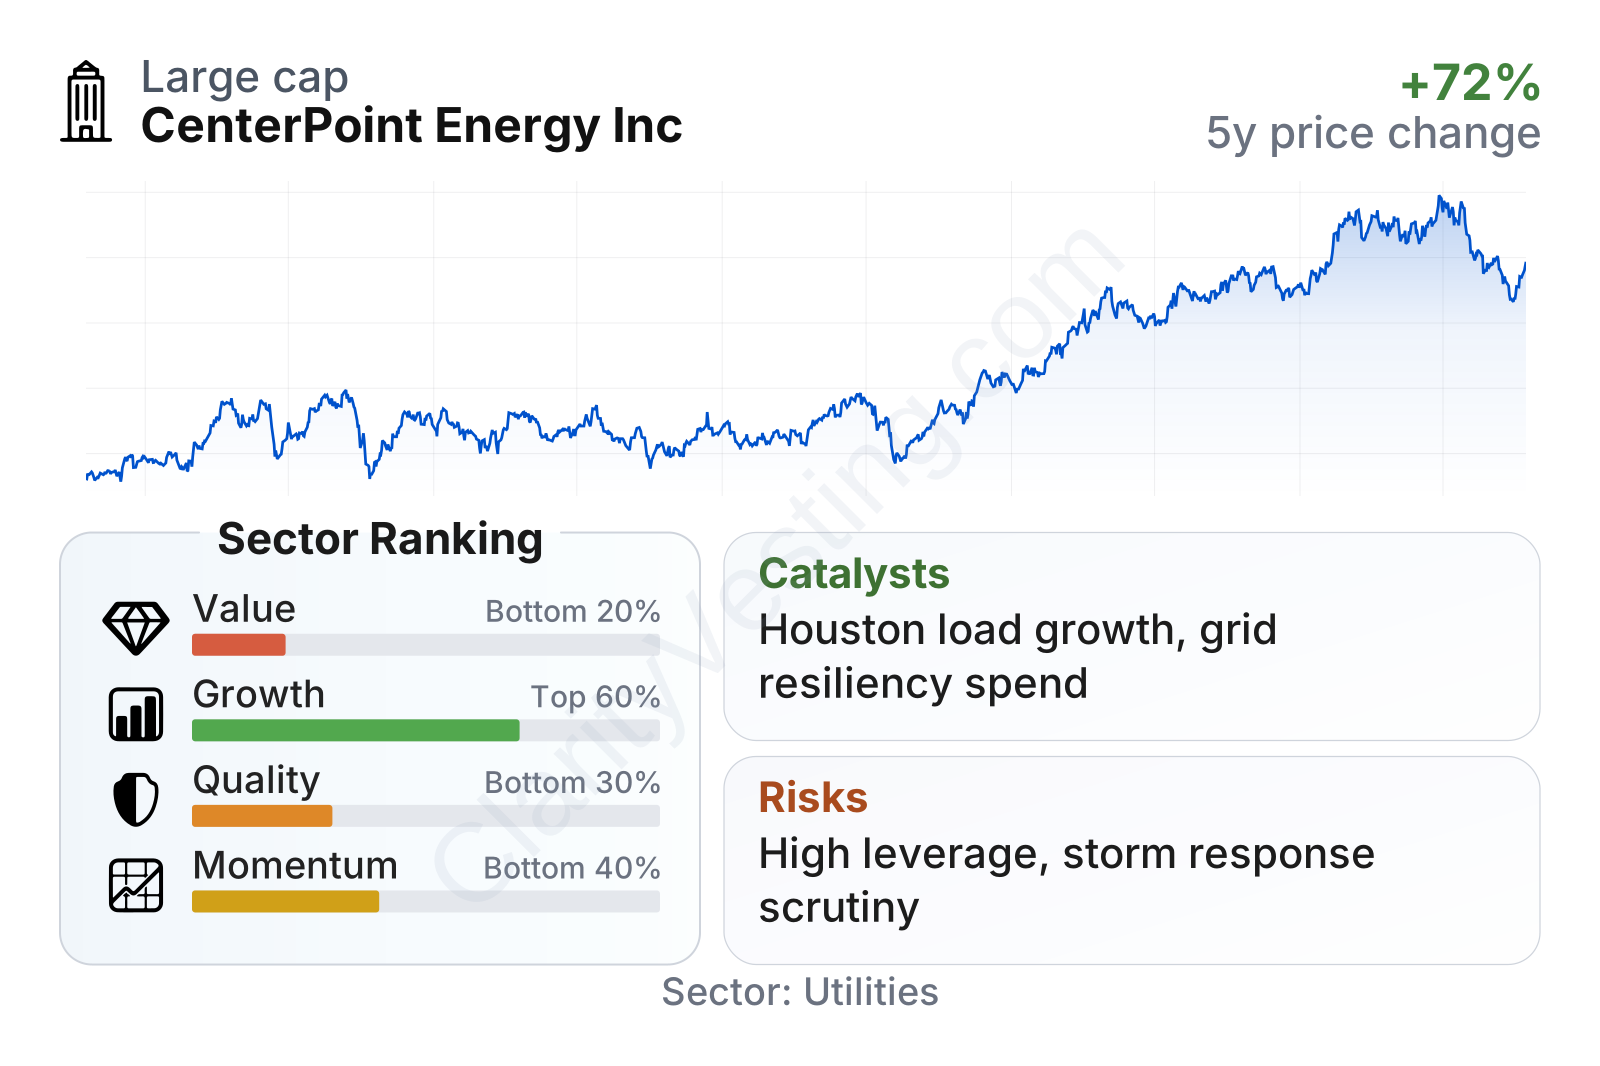
CenterPoint is a large utility with relatively low share-price volatility, reflected in a beta well below 1. That fits the profile of a regulated infrastructure business. The current factor mix is more mixed than purely defensive, though. Growth indicators are around the middle of the sector, helped by solid recent revenue growth and improving operating margin trends. By contrast, value, quality, and momentum rank weaker versus peers, mainly because the shares trade above sector-average valuation multiples while leverage and free cash flow remain stretched.
The stock’s multi-year price trend has been positive overall, but the recent pullback and weaker momentum versus the sector suggest the market has become more selective after a strong run. That shift matters because regulated utilities are often judged heavily on financing conditions, balance-sheet discipline, and confidence in future rate-base growth.
Growth
CenterPoint operates in a sector that is still growing, even if it does not look fast-growing in the way technology or consumer businesses might. Electric grids and gas distribution systems need continuous investment, and demand is being supported by population growth, electrification, industrial expansion, and grid hardening. In CenterPoint’s case, Texas is especially important. The Houston area continues to add residents, businesses, and power demand, which supports long-term expansion of regulated infrastructure.
The company’s strategy is straightforward and logical for a utility: invest heavily in transmission, distribution, system resilience, and safety, then seek regulatory approval to earn a return on those investments over time. This is not an explosive model, but it can create durable earnings growth when regulation remains constructive. CenterPoint has also emphasized resiliency work after severe weather events, which can turn a risk into a multi-year investment opportunity if regulators support cost recovery.
Revenue per share has been fairly steady rather than rapidly compounding. That is not unusual for a regulated utility, but it does show that the growth case depends more on earnings quality and approved infrastructure spending than on dramatic sales expansion. The latest annual revenue trend improved, yet the longer five-year picture remains moderate.
A strong catalyst for the company is the need to modernize and reinforce utility networks in its service territories. In Texas, load growth and reliability requirements can support major capital programs. Across the broader U.S. utility sector, more investment is also being directed toward storm hardening, transmission upgrades, distributed energy integration, and replacement of aging gas infrastructure. These trends align well with CenterPoint’s asset base.
Another growth support is the regulated nature of the business. When a utility expands its approved asset base, it can often increase earnings with less exposure to economic cycles than unregulated companies. That does not remove risk, but it gives CenterPoint a clearer path to future returns than many cyclical businesses.
The main caution within the growth picture is cash generation. Free cash flow has been deeply negative for several years, which reflects very heavy capital spending. In utilities, negative free cash flow is not automatically a warning sign because networks require large upfront investment. Still, it means future growth depends on access to debt and equity markets as well as favorable regulatory recovery. In other words, the growth plan makes industrial sense, but it is capital-intensive and financing-sensitive.
Recent company updates in 2026 have continued to center on grid investment, resiliency, and execution of capital plans rather than on transformational acquisitions or speculative expansions. That is consistent with what long-term observers usually want from a regulated utility: predictable development, not strategic surprises.
Risks
This article is for informational purposes only and does not constitute financial advice. Some content is AI-generated. See Disclaimer


