Stock Analysis · Core & Main Inc (CNM)
Overview
Core & Main is a specialized distributor of products used to build, repair, and maintain water, wastewater, storm drainage, and fire protection infrastructure. In simple terms, it sits between manufacturers and the contractors, utilities, municipalities, and other customers that need pipes, valves, hydrants, meters, treatment products, and related services. The company does not depend on one large project alone; it benefits from a broad base of recurring infrastructure work, including maintenance, replacement, upgrades, and new construction.
Its business is spread across public infrastructure and private non-residential and residential construction, but water-related public systems are the center of the model. That matters for long-term analysis because water networks tend to require ongoing replacement regardless of short-term economic swings.
Based on the company’s recent annual reporting, revenue is primarily generated from product categories tied to water systems and adjacent infrastructure. The mix can shift somewhat year to year, but the business is generally centered on the following areas:
- Pipe, valves and fittings: approximately 55% to 60% of revenue. This includes the core components used in potable water, wastewater, storm drainage, and fire protection systems.
- Storm drainage: approximately 10% to 15% of revenue. This includes products used to manage runoff, drainage, and related civil infrastructure.
- Fire protection: approximately 10% to 15% of revenue. This category includes products and systems supporting fire suppression networks.
- Meter products and other smart-water related items: approximately 10% to 15% of revenue. This includes meters, technology-enabled monitoring products, and related accessories.
- Treatment plant products and other categories: approximately 5% to 10% of revenue. This includes equipment and products used in water and wastewater treatment facilities.
The overall profit profile shows a business with large revenue volume, relatively modest net margins, and meaningful operating leverage. Revenue expanded strongly between fiscal 2022 and fiscal 2026, while net income also improved, although interest costs and operating expenses remain important factors to watch.
The business has moved from roughly $5.0 billion in annual revenue to about $7.6 billion over four fiscal years, while net income rose from about $166 million to roughly $441 million. That shows scale expansion, but also highlights how distribution remains a volume-driven business rather than a high-margin one.
Key Figures
| Metric | Value | Sector ⓘ |
|---|---|---|
| Date | Oct 17, 2026 | |
| Context | ||
| Sector | Industrials | |
| Industry | Industrial Distribution | |
| Market Cap ⓘ | $7.53B | |
| Beta ⓘ | 0.91 | |
Value (Cheapness) | ||
| P/E Ratio ⓘ | 16.80 | 22.10 |
| P/B Ratio ⓘ | 4.00 | 1.97 |
| FCF Yield ⓘ | 8.34% | 6.38% |
| Dividend Yield ⓘ | N/A | 1.94% |
| EBIT / EV ⓘ | 7.45% | 4.79% |
| PEG ⓘ | 1.46 | |
Growth (Business expansion) | ||
| Revenue Growth ⓘ | 2.50% | 9.30% |
| RPS Growth (5Y CAGR) ⓘ | 17.21% | 7.81% |
| EPS Growth (5Y CAGR) ⓘ | -2.02% | -13.06% |
| BVPS Growth (5Y CAGR) ⓘ | 15.67% | 6.14% |
| Margin Growth (5Y Trend) ⓘ | 2.05% | 0.88% |
| FCF Growth (5Y CAGR) ⓘ | N/A | 11.01% |
| DPS Growth (5Y CAGR) ⓘ | -26.01% | 9.48% |
Quality (Business durability) | ||
| ROIC (Latest) ⓘ | 13.87% | 10.84% |
| ROA (Latest) ⓘ | 7.06% | 5.41% |
| ROIC (5Y Median) ⓘ | 14.84% | 9.38% |
| ROA (5Y Median) ⓘ | 7.44% | 4.95% |
| Net Debt / EBIT (Latest) ⓘ | 3.17 | 2.08 |
| Net Debt / EBIT (5Y Median) ⓘ | 3.05 | 2.27 |
| Net Debt / EBITDA (Latest) ⓘ | 2.53 | 1.39 |
| Net Debt / Assets ⓘ | 36.32% | 19.28% |
| EBITDA / Interest ⓘ | 7.63 | 9.58 |
| Operating Margin (Latest) ⓘ | 9.99% | 10.50% |
| Operating Margin (5Y Median) ⓘ | 9.66% | 10.29% |
| Debt to Equity (Latest) ⓘ | 135.35% | 65.48% |
| Profit Margin (Latest) ⓘ | 5.96% | 6.67% |
| Free Cash Flow (Latest) ⓘ | $628.00M | |
Momentum (Price trend) | ||
| 3Y Return ⓘ | +28.83% | +61.68% |
| 12M Return (excl. last month) ⓘ | -16.15% | +12.58% |
| 6M Return ⓘ | -24.86% | 0.00% |
| Price vs. 200-Day MA ⓘ | -16.74% | +0.02% |
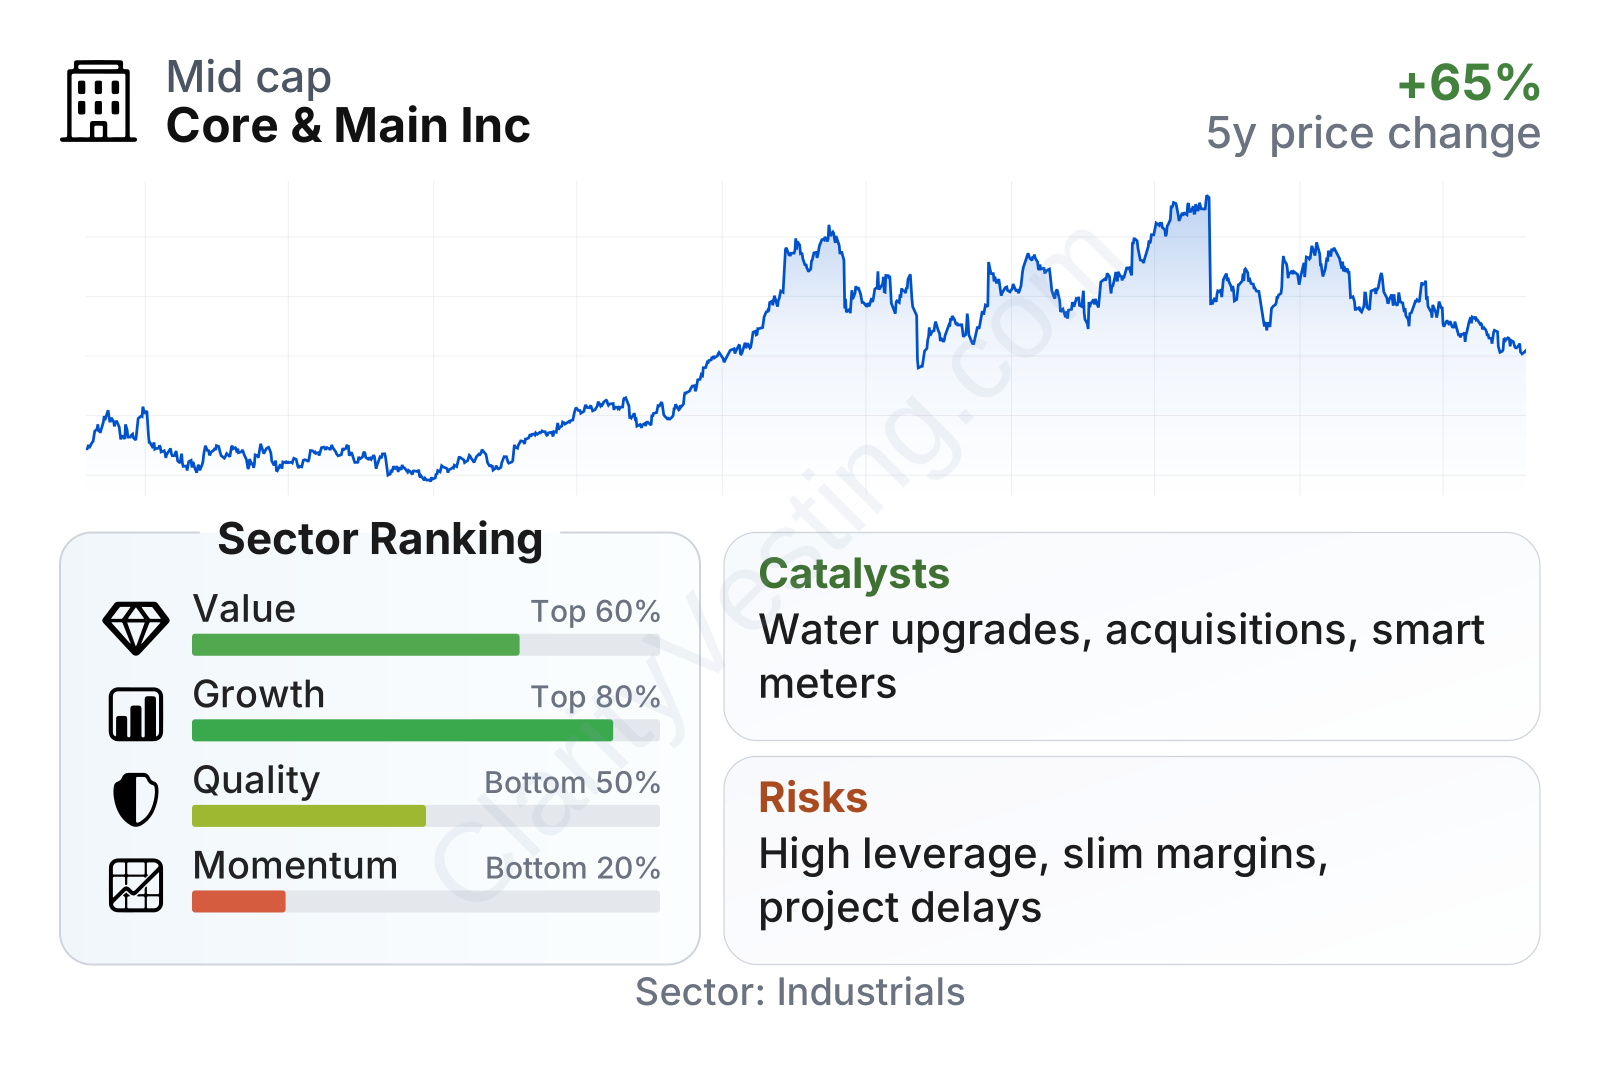
Core & Main is a mid-sized public company by U.S. market standards. The stock has been volatile over the last two years, with a strong run-up through 2024 and 2025 followed by a weaker trend more recently. In the factor snapshot, valuation looks somewhat more favorable than the broader sector, while growth ranks relatively well on a multi-year basis. Quality is mixed: returns on capital are solid, but leverage is noticeably higher than the sector median. Momentum is the weakest area, reflecting the stock’s recent pullback.
Growth
Core & Main operates in a sector with durable long-term demand. Water and wastewater infrastructure in the United States is old, replacement needs are significant, and local systems require constant maintenance. This is not a market driven only by new construction. A meaningful part of demand comes from repair and replacement work, which tends to be steadier over time. That gives the company exposure to a structural infrastructure need rather than a purely cyclical building trend.
The company’s strategy is also logical for long-term expansion. It combines organic growth through branch density, product breadth, and customer relationships with acquisitions that add geography, technical capabilities, and local market share. In distribution, scale matters because it can improve purchasing power, inventory availability, and service reliability. Core & Main has been building that scale across a fragmented market.
Recent revenue growth has clearly slowed from the unusually strong levels seen earlier in the cycle. After periods of double-digit and even much higher gains, growth cooled materially and briefly turned negative before returning to low single-digit expansion. That pattern suggests the company is now operating in a more normalized environment, with less help from inflation and post-pandemic demand surges.
Cash generation remains a notable strength. Free cash flow moved from negative territory several years ago to a much stronger level, including a peak above $1 billion before settling back into the roughly $600 million range. That still represents healthy cash production for a distributor and gives the company flexibility for acquisitions, debt management, and share repurchases.
A significant catalyst is the continuing flow of public funding and political focus on water infrastructure modernization in the United States. Programs tied to drinking water, wastewater systems, resilience, and lead service line replacement create a supportive backdrop for demand over multiple years. Another catalyst is the company’s increasing role in meter technologies, stormwater products, and fire protection, which broadens the addressable market beyond traditional pipe distribution.
Recent company updates have also pointed to continued acquisition activity and network expansion, which is important because this industry remains fragmented. If management continues integrating smaller distributors effectively, Core & Main can gain share even in a slower construction market.
Risks
This article is for informational purposes only and does not constitute financial advice. Some content is AI-generated. See Disclaimer


