Stock Analysis · CK Asset Holdings Limited (CNGKY)
Overview
CK Asset Holdings Limited is a Hong Kong-based property group controlled by the Li family. The business is best known for developing and investing in real estate, but it is broader than a typical homebuilder. In addition to residential and commercial property, the company owns hotels, infrastructure-related investments, aircraft leasing interests, and utility-style assets through associated investments. Its geographic exposure is also diversified, with Hong Kong remaining the core market while the group has meaningful assets and projects in Mainland China, the United Kingdom, Europe, and other overseas markets.
For long-term analysis, the most important point is that CK Asset is not driven by one single activity. Its results usually come from a mix of property development profits, recurring rental income, hotel and serviced suite operations, and earnings from investment holdings. That mix can soften the impact of weak property sales in any one year, but it also makes results less straightforward to read because property developers often recognize revenue unevenly when projects are completed.
Based on the company’s recent annual reporting structure, the main sources of revenue and earnings are concentrated in the following areas:
- Property sales and development: the largest contributor in most years, typically coming from residential and mixed-use projects in Hong Kong, Mainland China, and overseas markets. In recent years this appears to account for roughly 70% to 85% of reported revenue, depending on project completions.
- Property rental: recurring income from retail, office, industrial, and other investment properties. This is usually a smaller revenue line than development but more stable, often around 5% to 15% of revenue.
- Hotels and serviced suites: income from hotel operations and hospitality assets, generally a modest share, often around 3% to 8%.
- Aircraft leasing and infrastructure-related investments: these are not always large reported revenue contributors, but they can matter to profit and cash flow through operating income, associates, joint ventures, and investment returns.
- Other activities: property and project management, pub operations in the U.K. in prior periods, and assorted investment income.
The broad picture is a large real estate group with a conservative balance sheet, a sizable asset base, and a business model combining cyclical development income with some recurring cash-generating assets.
The business mix shows how uneven property development can be. Revenue and profit moved sharply from year to year as projects were completed, while operating profitability stayed meaningful even as earnings trended down from the 2022 peak. The latest period also shows revenue rebounding faster than net income, which suggests margin pressure rather than a simple demand recovery.
Key Figures
| Metric | Value | Sector ⓘ |
|---|---|---|
| Date | Oct 03, 2026 | |
| Context | ||
| Sector | Real Estate | |
| Industry | Real Estate - Development | |
| Market Cap ⓘ | $21.21B | |
| Beta ⓘ | 0.59 | |
Value (Cheapness) | ||
| P/E Ratio ⓘ | 12.62 | 17.35 |
| P/B Ratio ⓘ | 0.05 | 0.86 |
| FCF Yield ⓘ | 124.40% | 7.47% |
| Dividend Yield ⓘ | 3.79% | 4.75% |
| EBIT / EV ⓘ | N/A | 3.81% |
| PEG ⓘ | 0.78 | |
Growth (Business expansion) | ||
| Revenue Growth ⓘ | 58.80% | 5.30% |
| RPS Growth (5Y CAGR) ⓘ | 65.72% | 5.96% |
| EPS Growth (5Y CAGR) ⓘ | -47.93% | -11.41% |
| BVPS Growth (5Y CAGR) ⓘ | 2.10% | 0.41% |
| Margin Growth (5Y Trend) ⓘ | -13.46% | 0.53% |
| FCF Growth (5Y CAGR) ⓘ | -7.54% | 5.40% |
| DPS Growth (5Y CAGR) ⓘ | -1.82% | 5.02% |
Quality (Business durability) | ||
| ROIC (Latest) ⓘ | 6.33% | 5.77% |
| ROE (Latest) ⓘ | 6.36% | 7.64% |
| ROA (Latest) ⓘ | 5.00% | 2.85% |
| ROIC (5Y Median) ⓘ | 3.30% | 4.20% |
| ROE (5Y Median) ⓘ | 4.63% | 6.03% |
| ROA (5Y Median) ⓘ | 2.76% | 2.45% |
| Net Debt / EBIT (Latest) ⓘ | -0.28 | 7.57 |
| Net Debt / EBIT (5Y Median) ⓘ | 1.28 | 8.41 |
| Net Debt / EBITDA (Latest) ⓘ | -0.24 | 5.12 |
| Net Debt / Assets ⓘ | -1.85% | 37.84% |
| EBITDA / Interest ⓘ | N/A | 4.11 |
| Operating Margin (Latest) ⓘ | 27.14% | 35.40% |
| Operating Margin (5Y Median) ⓘ | 37.04% | 36.59% |
| Debt to Equity (Latest) ⓘ | 14.11% | 89.06% |
| Profit Margin (Latest) ⓘ | 18.55% | 19.99% |
| Free Cash Flow (Latest) ⓘ | $26.38B | |
Momentum (Price trend) | ||
| 3Y Return ⓘ | +34.31% | +30.60% |
| 12M Return (excl. last month) ⓘ | +24.16% | +7.55% |
| 6M Return ⓘ | +6.25% | +0.69% |
| Price vs. 200-Day MA ⓘ | +4.49% | -2.30% |
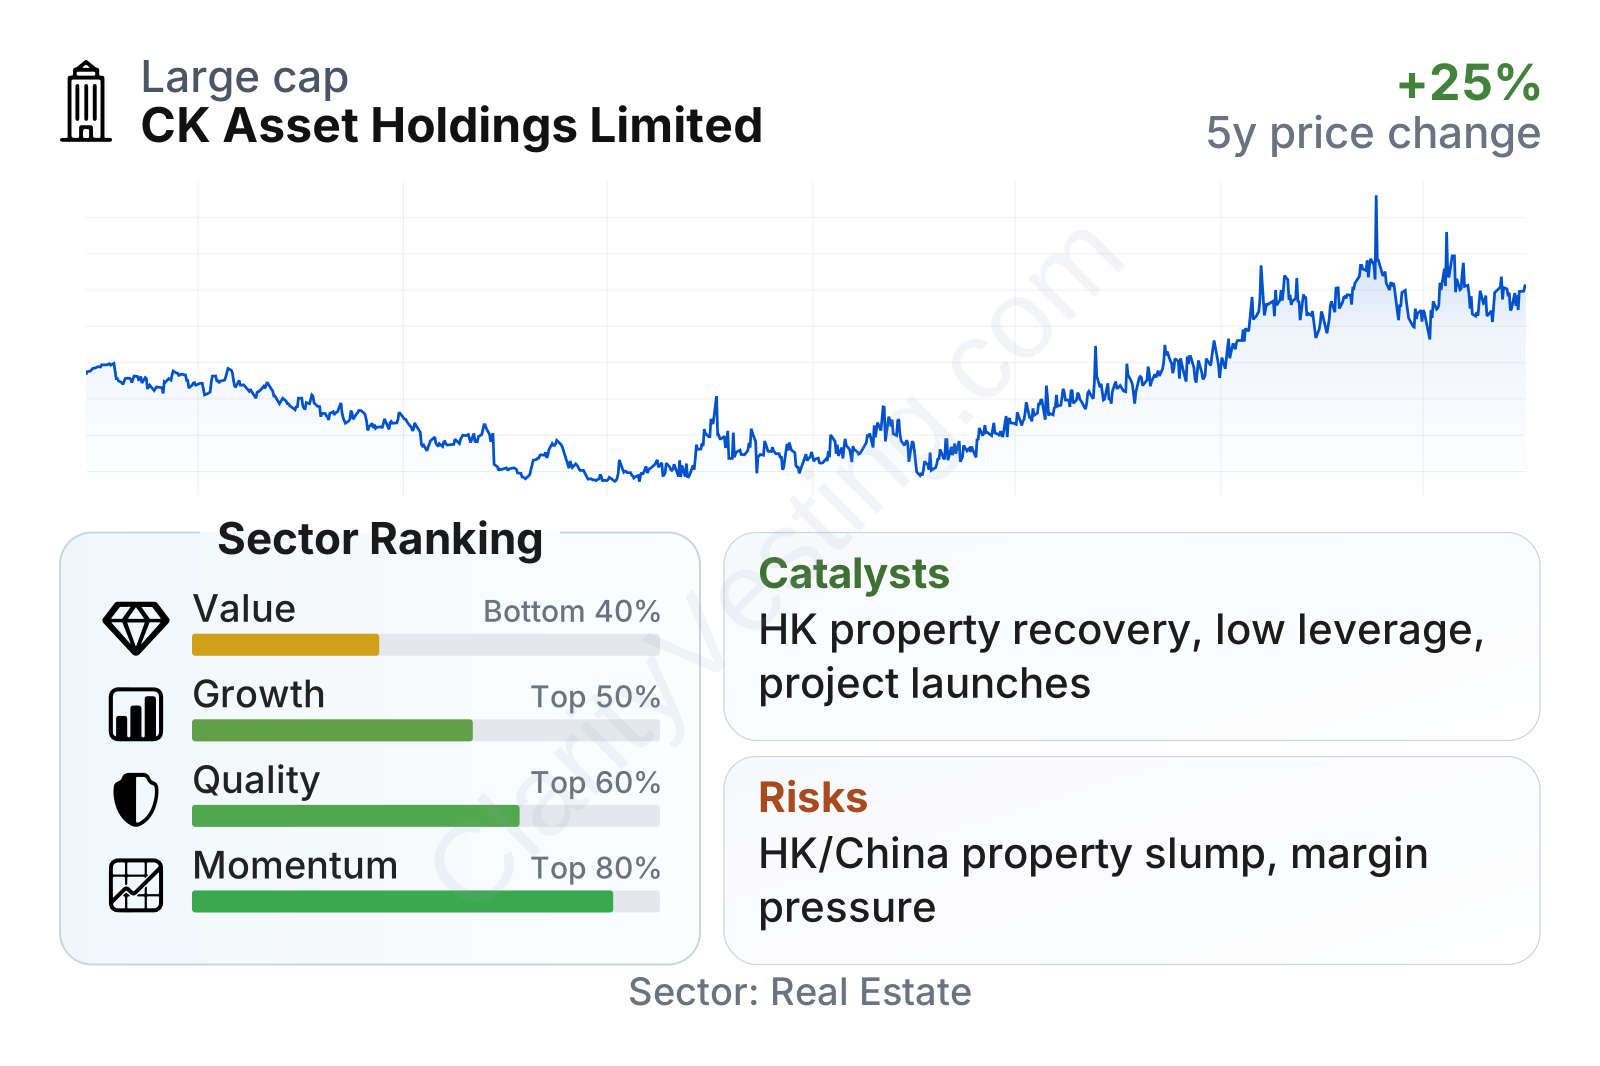
CK Asset stands out as a large-cap real estate company with unusually low share-price volatility, reflected in a beta well below 1. On valuation measures, earnings and growth-based multiples look modest, while the price-to-book ratio is exceptionally low versus the sector. Quality is mixed rather than weak: returns on capital and assets are acceptable, and the balance sheet is notably stronger than most peers, with low leverage and even net cash against operating profit. Growth indicators look good on revenue, but earnings, margins, free cash flow, and dividends have been less consistent over a five-year view. Recent stock performance has been stronger than much of the sector, which means market sentiment has improved even though the underlying business still shows some pressure on profitability.
Growth
CK Asset operates in a sector with long-term relevance but uneven growth. Real estate development is not a structural high-growth industry in the way cloud software or semiconductors can be. Instead, long-term expansion depends on land discipline, access to financing, project timing, and the ability to shift capital toward markets with better supply-demand conditions. That framework suits CK Asset reasonably well because the group has historically kept financial flexibility and has shown a willingness to invest across geographies rather than depend only on Hong Kong housing.
Its future growth logic rests on three pillars. First, the company still has a large development pipeline and investment property base, which can generate gains when projects are launched into healthier market windows. Second, its low leverage gives it room to pursue acquisitions or land replenishment when competitors are more constrained. Third, recurring income from rentals, hotels, and investment holdings provides support while waiting for development cycles to turn.
Revenue per share has been volatile but the broader direction over the last five years is upward, helped by project completions and the company’s ability to recycle capital. That pattern is common in real estate development: progress is rarely linear, and individual years can look weak or strong depending on handover schedules.
The dividend per share trend is less favorable. Payouts increased through 2023 and then moved lower in 2024 and 2025. That does not automatically indicate weakness, but it does suggest management is balancing distributions with caution as property markets remain uneven and earnings have not fully kept pace with revenue.
A meaningful catalyst is the possibility of recovery in Hong Kong and Mainland China property sentiment from depressed levels. Even a moderate improvement in transaction activity, financing conditions, or homebuyer confidence can have a noticeable impact on developers with substantial inventories and land banks. Another catalyst is capital deployment: companies with stronger balance sheets often gain opportunities when weaker rivals must sell assets, reduce land purchases, or delay projects.
Recent corporate updates have also pointed to ongoing project completions, property launches, and active portfolio management rather than a defensive retreat. For a company of this type, that matters because disciplined execution across a weak cycle often shapes the next several years of earnings.
Risks
This article is for informational purposes only and does not constitute financial advice. Some content is AI-generated. See Disclaimer


