Stock Analysis · Computershare Limited (CMSQF)
Overview
Computershare Limited is an Australian financial administration company best known for running share registries. In simple terms, it helps public companies keep track of who owns their stock, process dividends, manage shareholder communications, and handle corporate actions such as stock splits, rights issues, and proxy voting. Over time, the group has expanded into related services including employee share plans, mortgage servicing, bankruptcy and class action administration, and trust-related operations.
Its business is largely built around long-term operational contracts, regulated processes, and very high switching costs. Once a company chooses a transfer agent or share registry provider, changing systems can be disruptive and risky, which tends to make this activity stable and recurring rather than highly transactional.
Based on the company’s recent annual reporting, revenue is spread across several operating lines, with transaction-linked activity and client balances adding some variability from year to year. The broad mix can be summarized as follows:
- Issuer Services: approximately 45% to 55% of revenue. This is the core share registry and transfer agency activity, including shareholder records, corporate actions, proxy services, and communication services for listed companies.
- Mortgage Services and Property Rental Services: approximately 20% to 30%. This mainly includes U.S. mortgage servicing, loan administration, and related property-related processing.
- Employee Share Plans and Voucher Services: approximately 10% to 15%. This covers administration of employee stock plans and related plan services for corporate clients.
- Business Services / Corporate Trust / Governance-related services: approximately 10% to 15%. This includes specialized administration, stakeholder communications, and selected trust or governance support services.
- Interest income on client balances: a smaller but strategically important earnings source that can swing materially depending on short-term interest rates and the amount of cash held on behalf of clients.
One notable trend in recent years is that revenue and operating profit have both moved higher, while the business mix has become more favorable as interest income increased and margins improved. That matters because a meaningful part of Computershare’s earnings is linked not only to service fees, but also to the return it earns on client cash balances.
The financial flow over the past several years points to rising revenue, much stronger gross profit, and a clear lift in operating income. The biggest recent improvement appears to come from a richer revenue mix and better profitability rather than from pure top-line expansion alone.
Key Figures
| Metric | Value | Sector ⓘ |
|---|---|---|
| Date | Oct 03, 2026 | |
| Context | ||
| Sector | Financial Services | |
| Industry | Capital Markets | |
| Market Cap ⓘ | $17.09B | |
| Beta ⓘ | -0.02 | |
Value (Cheapness) | ||
| P/E Ratio ⓘ | 26.38 | 12.60 |
| P/B Ratio ⓘ | 7.51 | 1.23 |
| FCF Yield ⓘ | 9.30% | 10.16% |
| Dividend Yield ⓘ | 2.96% | 2.96% |
| EBIT / EV ⓘ | N/A | 7.77% |
| PEG ⓘ | 1.38 | |
Growth (Business expansion) | ||
| Revenue Growth ⓘ | 4.40% | 9.50% |
| RPS Growth (5Y CAGR) ⓘ | 7.58% | 12.10% |
| EPS Growth (5Y CAGR) ⓘ | -15.58% | -9.45% |
| BVPS Growth (5Y CAGR) ⓘ | 2.47% | 5.01% |
| Margin Growth (5Y Trend) ⓘ | 17.27% | -4.07% |
| FCF Growth (5Y CAGR) ⓘ | 20.65% | 4.96% |
| DPS Growth (5Y CAGR) ⓘ | 22.49% | 8.79% |
Quality (Business durability) | ||
| ROIC (Latest) ⓘ | N/A | 9.60% |
| ROE (Latest) ⓘ | 49.95% | 13.84% |
| ROA (Latest) ⓘ | 20.95% | 1.53% |
| ROIC (5Y Median) ⓘ | 11.62% | 7.86% |
| ROE (5Y Median) ⓘ | 16.56% | 12.20% |
| ROA (5Y Median) ⓘ | 4.86% | 1.29% |
| Net Debt / EBIT (Latest) ⓘ | N/A | 0.91 |
| Net Debt / EBIT (5Y Median) ⓘ | 0.73 | 0.74 |
| Net Debt / EBITDA (Latest) ⓘ | 0.13 | 0.97 |
| Operating Margin (Latest) ⓘ | N/A | 22.12% |
| Operating Margin (5Y Median) ⓘ | 20.97% | 24.39% |
| Debt to Equity (Latest) ⓘ | 59.34% | 60.37% |
| Profit Margin (Latest) ⓘ | 18.93% | 26.62% |
| Free Cash Flow (Latest) ⓘ | $1.59B | |
Momentum (Price trend) | ||
| 3Y Return ⓘ | +110.23% | +89.23% |
| 12M Return (excl. last month) ⓘ | +16.17% | +17.35% |
| 6M Return ⓘ | +47.07% | +10.00% |
| Price vs. 200-Day MA ⓘ | +25.34% | +3.73% |
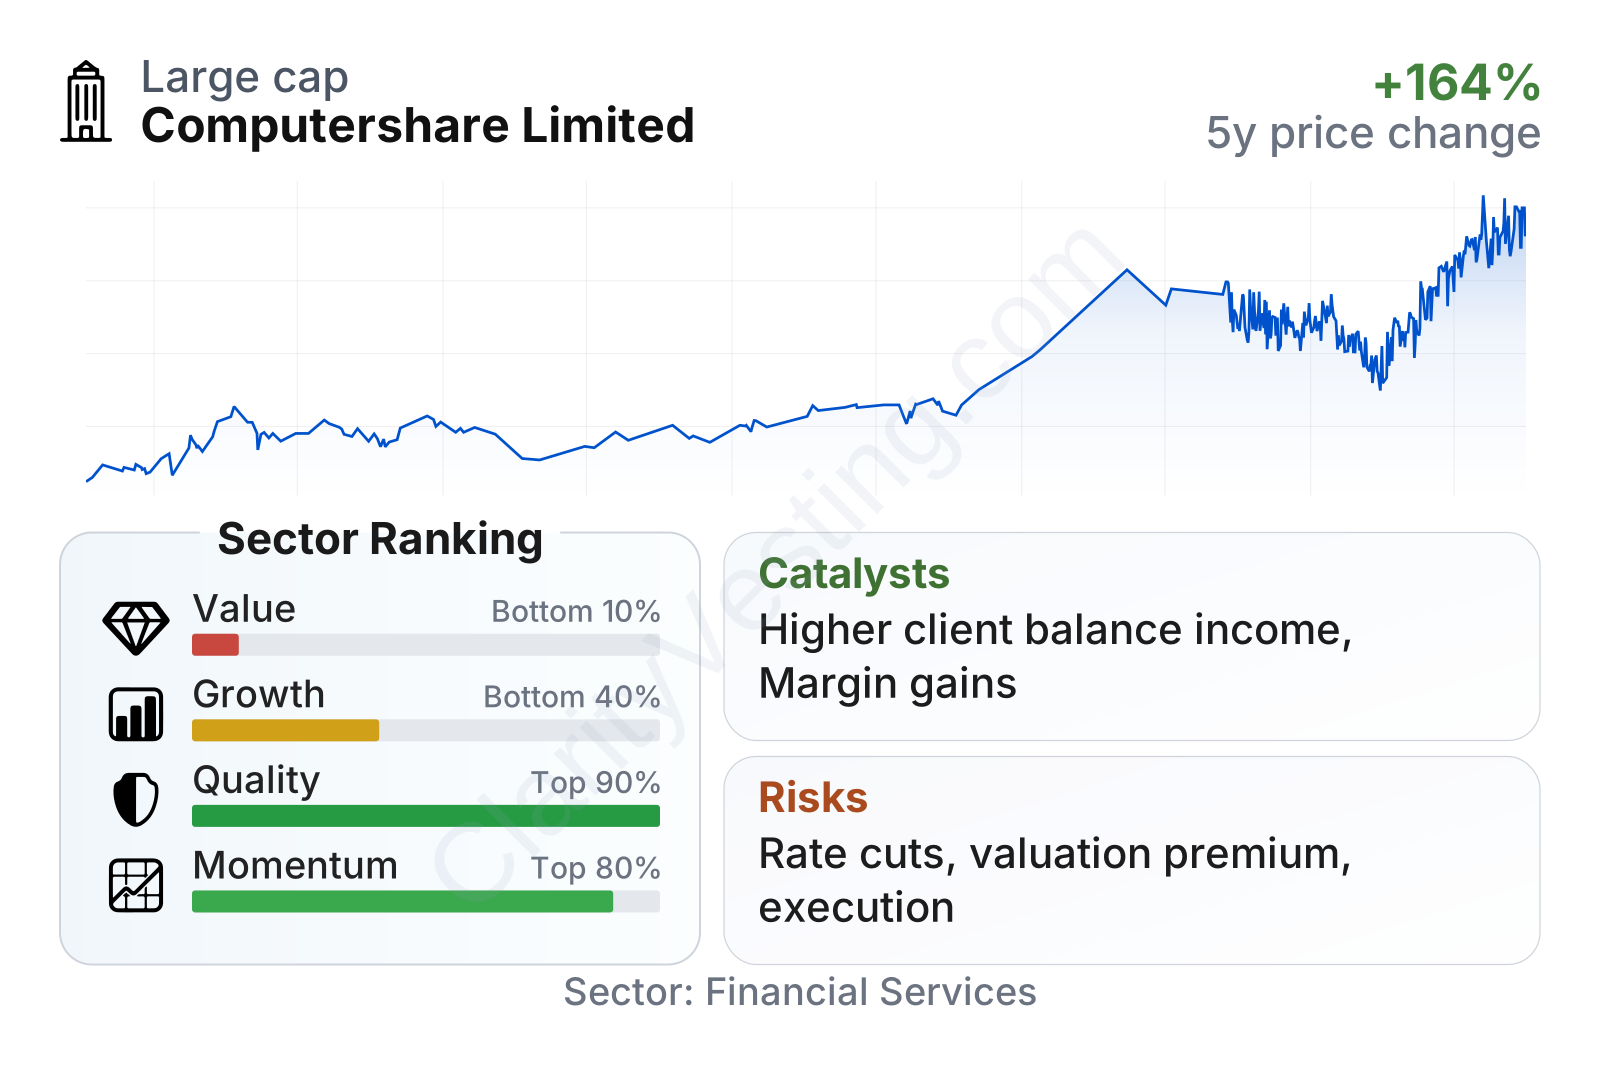
Computershare is a large company by market value, and its recent profile looks unusual in a good way on quality but demanding on valuation. Profitability metrics stand well above the sector median, with return on equity near 50% and return on assets above 20%, both far ahead of most financial services peers. Balance sheet leverage looks controlled, with net debt to EBITDA far below the sector norm.
On the other hand, valuation ratios are rich. The earnings multiple is more than double the sector median, and the price-to-book ratio is several times higher than typical peers. Growth is more mixed: recent revenue growth is positive but slower than the sector median, while longer-term earnings per share growth has been uneven. Market performance has been strong, especially over the last six months, which helps explain why valuation has expanded.
Growth
Computershare operates in parts of financial infrastructure that are mature rather than fast-moving, but that does not mean growth is absent. Shareholder administration, corporate governance, employee equity plans, and outsourced loan servicing all benefit from complexity, regulation, and the steady need for compliance. These are areas where clients often prefer scale, reliability, and proven systems over experimentation.
The group’s strategy for future growth is sensible because it combines recurring service revenue with selective exposure to market activity and interest rates. In practice, this means Computershare can benefit from several different drivers at once: more listed company activity, more employee share plan administration, continued outsourcing by financial institutions, and higher earnings on client cash when rates remain elevated.
Another positive element is operating discipline. Over five years, operating margin trends have improved materially even though revenue growth has not been exceptional. Free cash flow has also compounded at a much faster pace than the sector median, and dividend growth has been strong. That combination suggests the company has been improving the earnings quality of the business, not merely adding volume.
Even without a visible earnings-per-share chart here, the broader pattern is that per-share earnings have been more volatile than revenue because interest income, acquisition timing, and restructuring effects can influence year-to-year results. For long-term analysis, the more durable point is that underlying cash generation has remained strong and margins have held up well.
Book value per share has not moved in a perfectly smooth line, which is common for businesses affected by acquisitions, capital returns, and currency movements. The latest direction is upward again, but the longer-term increase has been modest compared with the current share price appreciation. That gap helps explain why the market is assigning a premium multiple.
Recent company updates have also highlighted ongoing business simplification and portfolio shaping. That matters because a cleaner operating structure can support margins and make the company easier to understand. A significant catalyst remains the earnings sensitivity to client balances and interest rates: if rates stay above the very low levels seen earlier in the decade, this can continue to support profits. In addition, continued demand for outsourced governance, registry, and mortgage servicing functions could provide steady incremental growth.
Risks
This article is for informational purposes only and does not constitute financial advice. Some content is AI-generated. See Disclaimer


