Stock Analysis · Cummins Inc (CMI)
Overview
Cummins Inc. is a large industrial company that designs, manufactures, and services engines, power systems, and related components. Its products are used in heavy-duty and medium-duty trucks, buses, construction and mining equipment, agriculture, marine, rail, defense, and power generation. In simple terms, Cummins helps vehicles and industrial equipment move, generate electricity, and meet emissions standards. The company also has a growing presence in lower-emission technologies such as natural gas, hybrid-related systems, battery-electric components, electrolyzers, and hydrogen fuel cell technologies through its Accelera business.
Cummins generates revenue from a mix of original equipment sales, replacement parts, and service. That matters because aftermarket parts and service can help soften the ups and downs of new equipment demand. Based on the company’s recent reporting structure, the main revenue sources are approximately:
- Engine segment: about 32% of revenue. This includes diesel, natural gas, and other powertrain solutions sold mainly for trucks, buses, and industrial uses.
- Components segment: about 28%. This covers turbochargers, filtration, fuel systems, valvetrain technologies, electronics, aftertreatment, axles, brakes, and transmission-related products.
- Distribution segment: about 26%. This includes parts, service, power generation packages, and regional distribution operations that support installed equipment in the field.
- Power Systems segment: about 14%. This includes generator sets, alternators, industrial engines, and related power solutions for backup and prime power needs.
- Accelera segment: currently a small share of revenue. This business includes batteries, ePowertrain systems, fuel cells, and electrolyzers, and is strategically more important than its current size suggests.
The revenue mix also shows a business that is broader than just truck engines. Cummins has built a large installed base over many years, and that supports recurring demand for service and replacement parts. Financially, revenue has stayed near record levels in recent years, while profitability has been more uneven because one-time items and cycle effects can strongly influence reported earnings.
Over the last several years, revenue expanded from roughly $24 billion to the low-to-mid $30 billion range, while gross profit held up relatively well. Operating income and net income were far more volatile, with a sharp dip in 2023 followed by a strong rebound in 2024 and some moderation afterward. That pattern suggests the business has meaningful earnings power, but also reminds readers that reported profit can move around much more than sales.
Key Figures
| Metric | Value | Sector ⓘ |
|---|---|---|
| Date | Oct 17, 2026 | |
| Context | ||
| Sector | Industrials | |
| Industry | Specialty Industrial Machinery | |
| Market Cap ⓘ | $72.87B | |
| Beta ⓘ | 1.24 | |
Value (Cheapness) | ||
| P/E Ratio ⓘ | 27.05 | 22.10 |
| P/B Ratio ⓘ | 6.18 | 1.97 |
| FCF Yield ⓘ | 4.62% | 6.38% |
| Dividend Yield ⓘ | 1.52% | 1.94% |
| EBIT / EV ⓘ | 5.04% | 4.79% |
| PEG ⓘ | 1.06 | |
Growth (Business expansion) | ||
| Revenue Growth ⓘ | 9.40% | 9.30% |
| RPS Growth (5Y CAGR) ⓘ | 10.19% | 7.81% |
| EPS Growth (5Y CAGR) ⓘ | -6.38% | -13.06% |
| BVPS Growth (5Y CAGR) ⓘ | 12.00% | 6.14% |
| Margin Growth (5Y Trend) ⓘ | 0.83% | 0.88% |
| FCF Growth (5Y CAGR) ⓘ | 12.87% | 11.01% |
| DPS Growth (5Y CAGR) ⓘ | 8.22% | 9.48% |
Quality (Business durability) | ||
| ROIC (Latest) ⓘ | 14.14% | 10.84% |
| ROA (Latest) ⓘ | 7.84% | 5.41% |
| ROIC (5Y Median) ⓘ | 17.20% | 9.38% |
| ROA (5Y Median) ⓘ | 8.68% | 4.95% |
| Net Debt / EBIT (Latest) ⓘ | 1.32 | 2.08 |
| Net Debt / EBIT (5Y Median) ⓘ | 1.23 | 2.27 |
| Net Debt / EBITDA (Latest) ⓘ | 1.03 | 1.39 |
| Net Debt / Assets ⓘ | 14.33% | 19.28% |
| EBITDA / Interest ⓘ | 15.51 | 9.58 |
| Operating Margin (Latest) ⓘ | 11.12% | 10.50% |
| Operating Margin (5Y Median) ⓘ | 11.91% | 10.29% |
| Debt to Equity (Latest) ⓘ | 64.50% | 65.48% |
| Profit Margin (Latest) ⓘ | 7.82% | 6.67% |
| Free Cash Flow (Latest) ⓘ | $3.37B | |
Momentum (Price trend) | ||
| 3Y Return ⓘ | +145.43% | +61.68% |
| 12M Return (excl. last month) ⓘ | +33.82% | +12.58% |
| 6M Return ⓘ | -13.97% | 0.00% |
| Price vs. 200-Day MA ⓘ | -12.45% | +0.02% |
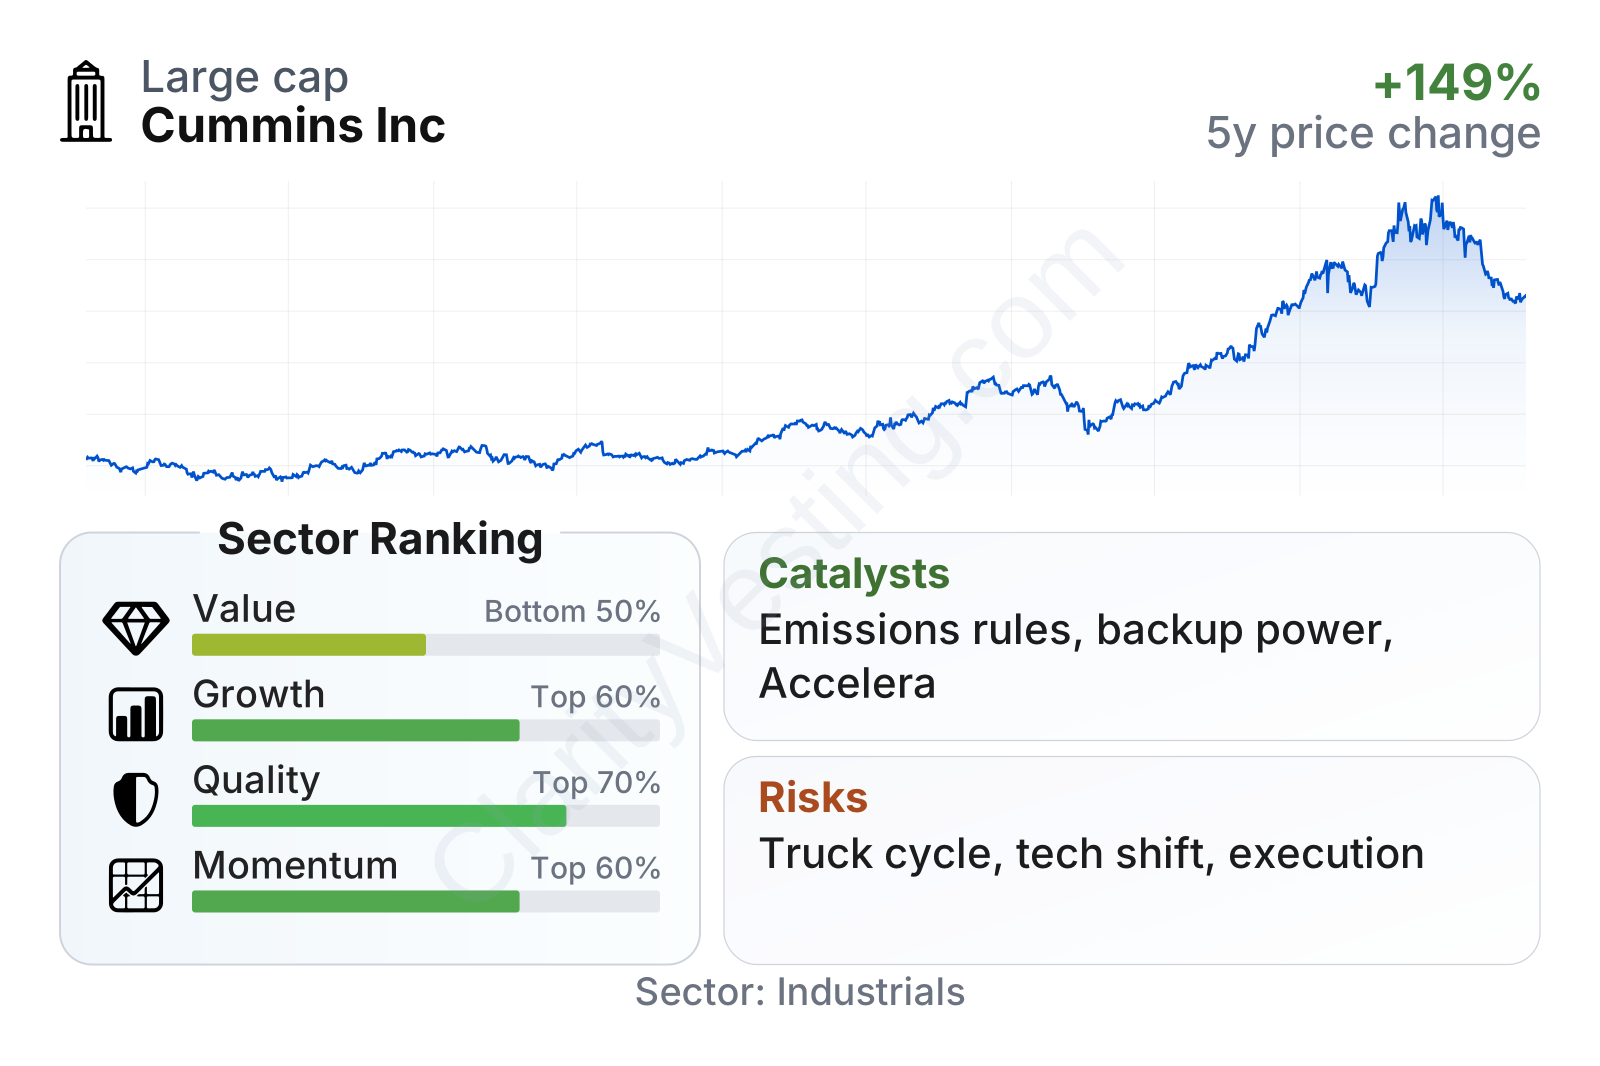
Cummins is a large-cap industrial company with share-price performance that has been very strong over the last three years, although recent trading has become less smooth after that major run-up. On fundamental measures, the business stands out more for quality and operational strength than for cheapness. Returns on capital and assets are above the sector median, leverage looks manageable, and cash generation has improved over time. By contrast, valuation measures are no longer notably discounted versus the broader industrial peer group, and some are now above typical sector levels.
Growth
Cummins operates in markets that are mature in some areas but still attractive over a full cycle. Heavy-duty engines and power systems are not high-growth categories every year, yet long-term demand is supported by freight movement, infrastructure spending, electrification of critical facilities, data center backup power needs, and tightening emissions rules. This creates a mix of cyclical demand and structural opportunity.
The company’s strategy for future growth is logical because it does not depend on a single technology outcome. Cummins is still investing in its core diesel and natural gas platforms, where reliability, service reach, and emissions compliance remain essential. At the same time, it is building positions in zero- and lower-emission technologies through Accelera. That balanced approach is important in commercial vehicles, where customers often adopt new technologies more slowly than passenger car markets because total cost, uptime, and fueling infrastructure matter so much.
Recent sales growth has been uneven, which is normal for an industrial company exposed to truck production and equipment cycles. After a period of very strong expansion in 2022 and 2023, growth cooled, briefly turned negative, and then improved again by mid-2026. That recovery matters because it suggests demand has not simply rolled over after the post-pandemic surge.
Cash generation is another positive element. Free cash flow has been volatile, including a very weak period in 2025, but it recovered sharply afterward and remains solid in absolute terms. Over a five-year view, cash flow growth has outpaced the sector median, which supports Cummins’ ability to fund capital spending, research, and shareholder distributions without stretching the balance sheet too aggressively.
A major catalyst is the tightening of emissions standards for commercial vehicles in North America and other markets. Cummins has experience helping customers comply with changing regulations, and this tends to reward companies with deep engineering resources and established customer relationships. Another catalyst is the demand for backup power and distributed energy systems, especially as utilities face grid strain and digital infrastructure expands. Cummins’ Power Systems segment is well placed to benefit from that need.
Recent company developments also point to longer-term opportunity in hydrogen and electrolyzer markets, even though these businesses are still small relative to the overall company. The key point is not that these newer areas transform near-term revenue, but that they give Cummins additional paths to stay relevant if powertrain technology shifts over the next decade.
Risks
This article is for informational purposes only and does not constitute financial advice. Some content is AI-generated. See Disclaimer


