Stock Analysis · Chemring Group PLC (CMGMY)
Overview
Chemring Group PLC is a U.K.-based defense technology company focused on products that help armed forces detect threats, protect platforms, and complete missions more safely. Its activities are centered on two main areas: Countermeasures & Energetics, which includes decoys, flares, and energetic devices used on aircraft, naval platforms, and other defense systems; and Sensors & Information, which includes chemical and biological threat detection, electronic warfare support, and software-based intelligence tools. In simple terms, Chemring sells specialized defense equipment designed to improve survivability and situational awareness.
The business is primarily funded by government and defense customers, especially in the U.K., U.S., NATO countries, and allied markets. Chemring is not a broad prime contractor like the largest defense groups; instead, it occupies niche positions in mission-critical products where reliability, certification, and long customer relationships matter a great deal.
Based on recent annual reporting, revenue is broadly split as follows:
- Countermeasures & Energetics: about 55% to 60% of revenue. This includes expendable countermeasures such as flares and chaff, as well as energetic components and propulsion-related products used in defense applications.
- Sensors & Information: about 40% to 45% of revenue. This includes biological and chemical detection systems, electronic warfare-related sensing, and software/intelligence support products.
That mix matters because it gives Chemring exposure both to recurring replenishment demand in consumable defense products and to higher-value sensing and data-oriented systems that can support longer-term capability upgrades.
The overall financial picture over the past several years shows a company that has expanded revenue meaningfully since 2021, while profitability has been somewhat uneven from year to year. Sales moved from roughly $390 million in fiscal 2021 to around $500 million in fiscal 2025, and operating income improved more clearly than net income, suggesting the core business has been progressing even if below-the-line items have added volatility.
The long-term pattern points to a larger business with better operating earnings than a few years ago, although recent revenue was not perfectly linear. One notable feature is sustained spending on development and capability building in prior years, which fits the profile of a defense specialist trying to protect niche technology positions rather than simply maximizing short-term profit.
Key Figures
| Metric | Value | Sector ⓘ |
|---|---|---|
| Date | Oct 31, 2026 | |
| Context | ||
| Sector | Industrials | |
| Industry | Aerospace & Defense | |
| Market Cap ⓘ | $2.03B | |
| Beta ⓘ | 0.79 | |
Value (Cheapness) | ||
| P/E Ratio ⓘ | 44.12 | 21.91 |
| P/B Ratio ⓘ | 5.65 | 1.97 |
| FCF Yield ⓘ | -0.49% | 6.34% |
| Dividend Yield ⓘ | 1.45% | 1.88% |
| EBIT / EV ⓘ | N/A | 4.83% |
| PEG ⓘ | 1.95 | |
Growth (Business expansion) | ||
| Revenue Growth ⓘ | 6.50% | 9.50% |
| RPS Growth (5Y CAGR) ⓘ | 7.18% | 7.67% |
| EPS Growth (5Y CAGR) ⓘ | N/A | -11.63% |
| BVPS Growth (5Y CAGR) ⓘ | 3.09% | 6.14% |
| Margin Growth (5Y Trend) ⓘ | 1.94% | 0.71% |
| FCF Growth (5Y CAGR) ⓘ | N/A | 11.01% |
| DPS Growth (5Y CAGR) ⓘ | 25.31% | 9.31% |
Quality (Business durability) | ||
| ROIC (Latest) ⓘ | 21.03% | 10.70% |
| ROA (Latest) ⓘ | 9.66% | 5.45% |
| ROIC (5Y Median) ⓘ | 11.16% | 9.33% |
| ROA (5Y Median) ⓘ | 6.20% | 4.94% |
| Net Debt / EBIT (Latest) ⓘ | 1.10 | 2.03 |
| Net Debt / EBIT (5Y Median) ⓘ | 0.91 | 2.28 |
| Net Debt / EBITDA (Latest) ⓘ | 0.77 | 1.37 |
| Net Debt / Assets ⓘ | 15.89% | 19.16% |
| EBITDA / Interest ⓘ | 14.78 | 9.73 |
| Operating Margin (Latest) ⓘ | 12.89% | 10.49% |
| Operating Margin (5Y Median) ⓘ | 12.32% | 10.30% |
| Debt to Equity (Latest) ⓘ | 51.26% | 65.91% |
| Profit Margin (Latest) ⓘ | 6.62% | 6.61% |
| Free Cash Flow (Latest) ⓘ | -$9.87M | |
Momentum (Price trend) | ||
| 3Y Return ⓘ | +133.79% | +69.18% |
| 12M Return (excl. last month) ⓘ | -8.94% | +12.04% |
| 6M Return ⓘ | +6.32% | +0.22% |
| Price vs. 200-Day MA ⓘ | +5.73% | +0.19% |
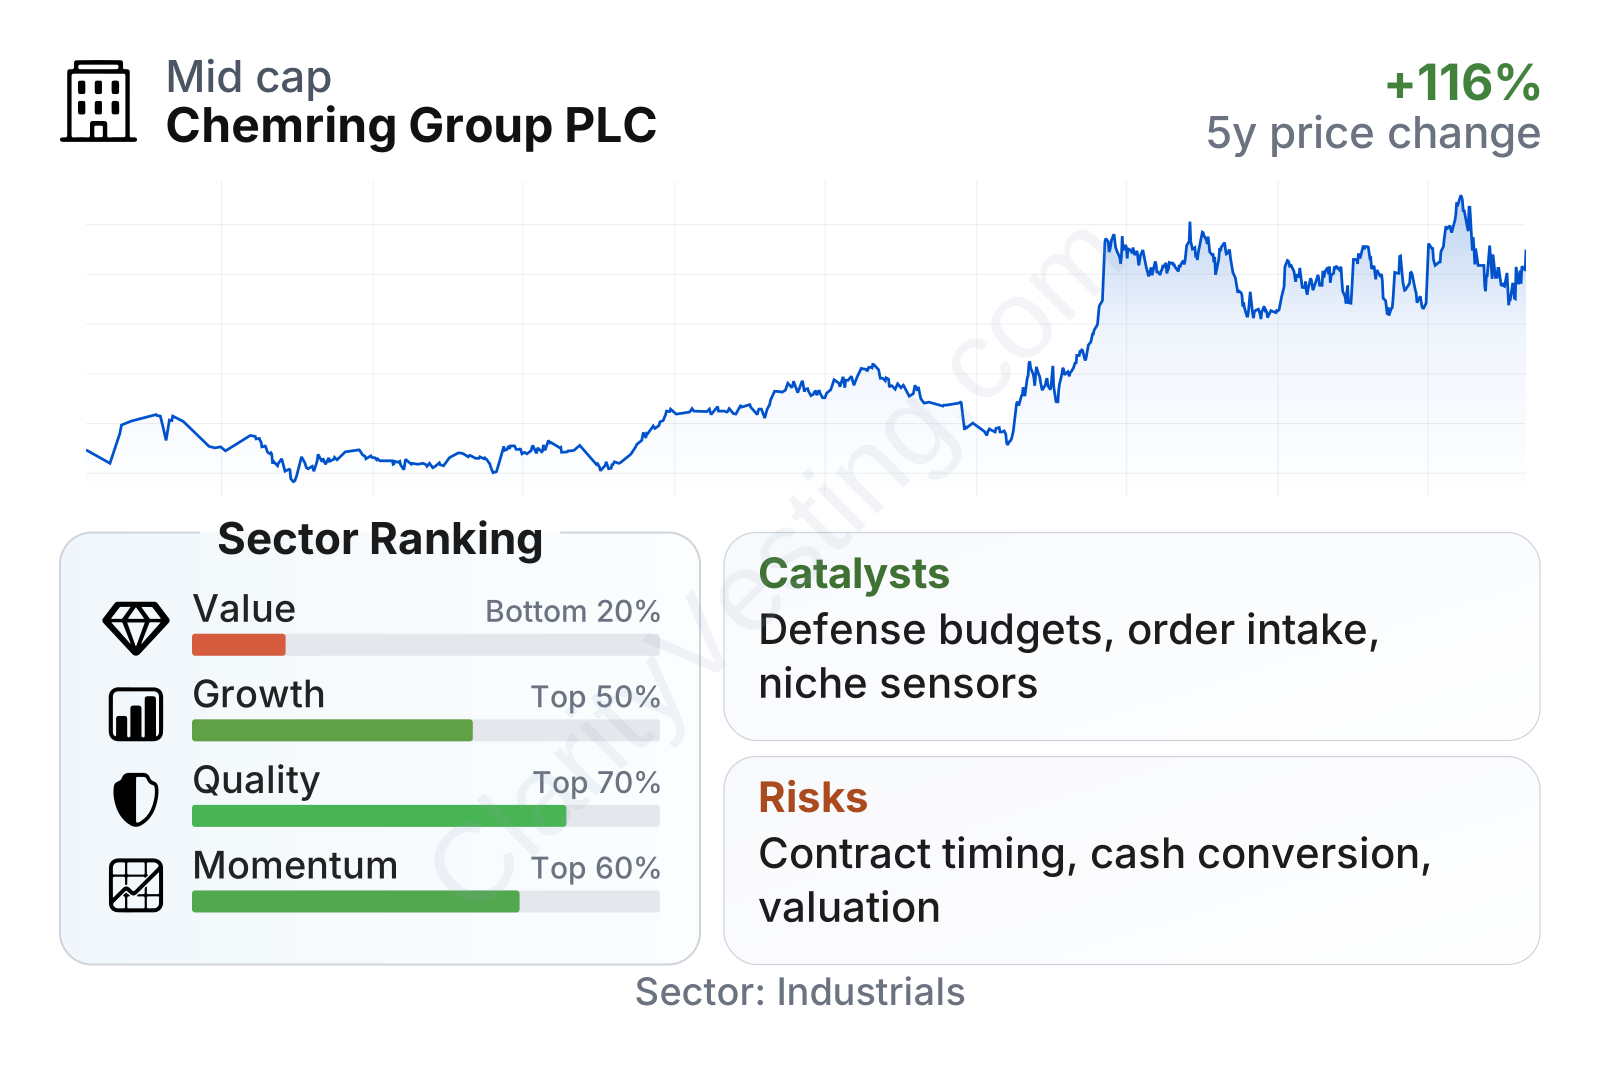
Chemring currently sits in the mid-cap range and its share price has risen strongly over the past three years, clearly ahead of the sector median over that period. More recently, momentum has been mixed: the stock has recovered over the last six months and remains above its 200-day average, but the prior 12-month period was softer than the broader aerospace and defense group.
On profitability and balance sheet strength, the company looks solid. Return on invested capital is around 21%, well above the sector median, and operating margin is also better than the industry midpoint at roughly 13%. Leverage is moderate rather than aggressive, with net debt below 1x EBITDA and interest coverage comfortably above sector norms. That combination suggests a business with decent earnings quality and manageable financial risk.
The weaker area is valuation and cash generation. The earnings multiple and book multiple are both materially above sector medians, while free cash flow over the last twelve months was slightly negative. In other words, the market is assigning Chemring a premium despite cash conversion that has recently been less convincing than accounting profitability. Growth metrics are respectable rather than exceptional, with recent revenue expansion below the sector median, although margin improvement over five years has been stronger than average.
Growth
The sector backdrop is supportive. Defense budgets across many Western countries have been rising, with renewed emphasis on stockpile replenishment, air and missile defense, force protection, electronic warfare, and chemical/biological preparedness. Those priorities align well with Chemring’s portfolio. Unlike some industrial markets that depend heavily on consumer demand or economic cycles, defense spending is usually tied more closely to government budgets, security priorities, and multi-year procurement plans.
Chemring’s strategy also makes sense for future expansion because it focuses on specialized segments rather than trying to compete across the entire defense value chain. In countermeasures, demand can benefit from the need to replenish inventories and equip more platforms. In sensors and information products, growth can come from militaries seeking better detection, autonomy support, data integration, and battlefield awareness. These are areas where switching suppliers can be difficult once products are qualified, which can support durable customer relationships.
Near-term growth is not completely smooth, and the latest yearly revenue change points to a decline of roughly 8%. That should be viewed in context rather than in isolation. Defense companies, especially niche suppliers, can show uneven annual sales depending on contract timing, production phasing, and program schedules. More important is whether the company continues to win work, expand capability, and maintain healthy margins. On that front, the broader pattern still supports a business that is larger and more profitable than it was several years ago.
A meaningful catalyst is Chemring’s exposure to areas that have become more strategically important: survivability systems, energetics, electronic sensing, and chemical/biological detection. Another catalyst is the company’s established position in U.S. and allied defense markets, where procurement visibility can be better than in purely commercial industries. Recent company communications have also highlighted order intake and contract activity that support medium-term revenue visibility, which is particularly relevant for a business where market confidence often depends on future program flow rather than one single year of sales.
Risks
This article is for informational purposes only and does not constitute financial advice. Some content is AI-generated. See Disclaimer


