Stock Analysis · Chemring Group PLC (CMGMF)
Overview
Chemring Group PLC is a U.K.-based aerospace and defense company focused on products that help military and national security customers detect threats, protect platforms and people, and improve mission effectiveness. Its activities are concentrated in areas such as countermeasures, sensors, energetic materials, and niche defense technologies. In simple terms, Chemring sells specialized equipment and components used by armed forces, security agencies, and prime defense contractors rather than consumer-facing products.
The business is organized around two main segments. In recent annual reporting, revenue has come primarily from countermeasures and energetics, with sensors and information-related products forming the second major source. The mix can move from year to year depending on contract timing, but the broad revenue structure is usually as follows:
- Countermeasures & Energetics: approximately 55% to 65% of revenue. This includes flares, decoys, propellants, pyrotechnics, and other energetic products used to protect aircraft, ships, and military systems.
- Sensors & Information: approximately 35% to 45% of revenue. This includes chemical and biological threat detection, electronic warfare support products, and related sensing technologies for defense and security customers.
Geographically, Chemring has meaningful exposure to the U.K. and the U.S., with additional sales to allied governments and defense contractors in Europe and other international markets. That matters because the company is tied less to one single procurement budget than some smaller defense suppliers, although large Western defense budgets still drive the overall demand picture.
The business model is attractive when looked at from a long-term operating perspective: customers tend to be governments or prime contractors, products are often mission-critical, qualification standards are high, and switching suppliers is not always easy. At the same time, earnings can be uneven because contract awards, production timing, and project milestones do not arrive in a perfectly smooth pattern.
The operating picture over the last several years shows a company that has lifted revenue from roughly the low-$400 million range to around $500 million, while operating income has improved more clearly than sales. That suggests better mix, pricing, or execution. One notable feature is that research and development spending rose sharply in 2023, showing an effort to build future programs, even though that likely weighed on near-term reported profit.
Key Figures
| Metric | Value | Sector ⓘ |
|---|---|---|
| Date | Oct 17, 2026 | |
| Context | ||
| Sector | Industrials | |
| Industry | Aerospace & Defense | |
| Market Cap ⓘ | $1.89B | |
| Beta ⓘ | 0.79 | |
Value (Cheapness) | ||
| P/E Ratio ⓘ | 41.18 | 22.10 |
| P/B Ratio ⓘ | 5.26 | 1.97 |
| FCF Yield ⓘ | -0.50% | 6.38% |
| Dividend Yield ⓘ | 1.16% | 1.94% |
| EBIT / EV ⓘ | N/A | 4.79% |
| PEG ⓘ | 1.98 | |
Growth (Business expansion) | ||
| Revenue Growth ⓘ | 6.50% | 9.30% |
| RPS Growth (5Y CAGR) ⓘ | 7.18% | 7.81% |
| EPS Growth (5Y CAGR) ⓘ | N/A | -13.06% |
| BVPS Growth (5Y CAGR) ⓘ | 3.09% | 6.14% |
| Margin Growth (5Y Trend) ⓘ | 1.94% | 0.88% |
| FCF Growth (5Y CAGR) ⓘ | N/A | 11.01% |
| DPS Growth (5Y CAGR) ⓘ | 25.47% | 9.48% |
Quality (Business durability) | ||
| ROIC (Latest) ⓘ | 22.16% | 10.84% |
| ROA (Latest) ⓘ | 10.19% | 5.41% |
| ROIC (5Y Median) ⓘ | 11.16% | 9.38% |
| ROA (5Y Median) ⓘ | 6.20% | 4.95% |
| Net Debt / EBIT (Latest) ⓘ | 1.05 | 2.08 |
| Net Debt / EBIT (5Y Median) ⓘ | 0.91 | 2.27 |
| Net Debt / EBITDA (Latest) ⓘ | 0.75 | 1.39 |
| Net Debt / Assets ⓘ | 15.91% | 19.28% |
| EBITDA / Interest ⓘ | 15.27 | 9.58 |
| Operating Margin (Latest) ⓘ | 13.51% | 10.50% |
| Operating Margin (5Y Median) ⓘ | 12.32% | 10.29% |
| Debt to Equity (Latest) ⓘ | 51.32% | 65.48% |
| Profit Margin (Latest) ⓘ | 6.62% | 6.67% |
| Free Cash Flow (Latest) ⓘ | -$9.44M | |
Momentum (Price trend) | ||
| 3Y Return ⓘ | +102.22% | +61.68% |
| 12M Return (excl. last month) ⓘ | -2.44% | +12.58% |
| 6M Return ⓘ | -3.05% | 0.00% |
| Price vs. 200-Day MA ⓘ | +13.45% | +0.02% |
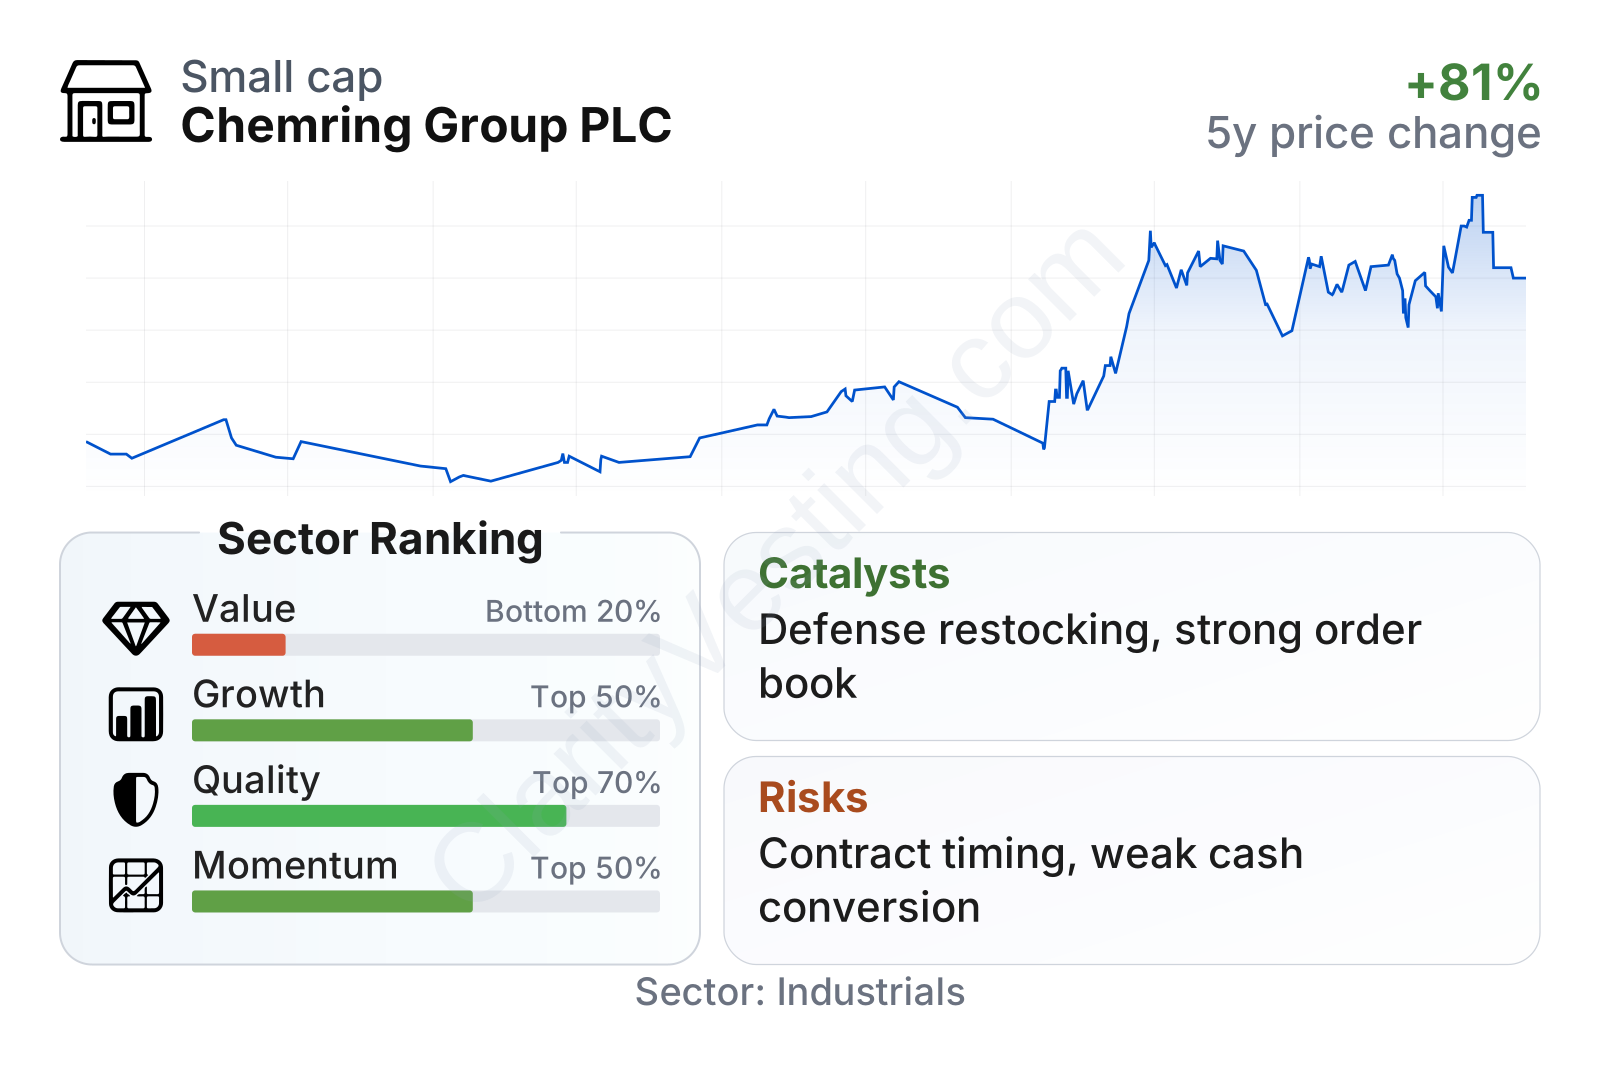
Chemring sits in the mid-cap range, with a share price record that has been strong over the past three years even if more recent performance has been steadier. The quality profile looks better than much of the broader aerospace and defense group: returns on invested capital and assets are comfortably above sector medians, operating margins are also above typical peers, and leverage remains moderate with debt metrics better than many companies in the same sector.
The weaker area is valuation and cash conversion. The shares trade on a higher earnings multiple and a much higher book multiple than sector medians, while free cash flow has recently been negative and the free-cash-flow yield is below the industry norm. Growth is respectable rather than exceptional: revenue has been rising, margin trends have improved, and dividend growth has been strong over five years, but top-line growth still trails the sector median.
Growth
Chemring operates in a sector that continues to benefit from a durable global tailwind. Defense spending has been increasing across NATO countries and many allied states, driven by geopolitical tension, replenishment of munitions inventories, higher readiness requirements, and rising emphasis on electronic warfare, missile defense, survivability, and battlefield sensing. These trends align well with Chemring’s niche product set.
The company’s strategy also makes industrial sense. It is not trying to compete head-on with the largest defense primes across every category. Instead, it focuses on specialized areas where certification, performance requirements, and customer trust create barriers to entry. That approach can support steady long-term demand, especially in expendable countermeasures and threat detection products where replacement cycles and training usage provide recurring activity in addition to new platform demand.
A meaningful catalyst is ammunition and defense stock replenishment across Western militaries. Countermeasures, energetic materials, and survivability products fit directly into that spending cycle. Another growth angle is the broader modernization of military aircraft, naval fleets, and land systems, which tends to support demand for decoys, sensors, and threat detection systems. Chemring’s exposure to both expendables and advanced sensing gives it more than one route to participate in rising defense budgets.
Recent company reporting has pointed to solid order intake and a healthy order book, which is important because it improves revenue visibility in a sector where project timing can otherwise be lumpy. If that backlog continues converting into sales while margins hold near current levels, Chemring could keep expanding earnings faster than revenue. The long-term setup therefore looks supported more by defense demand and specialized positioning than by any single breakthrough event.
Risks
This article is for informational purposes only and does not constitute financial advice. Some content is AI-generated. See Disclaimer


