Stock Analysis · CMB.TECH NV (CMBT)
Overview
CMB.TECH NV is a maritime transportation and infrastructure company with roots in shipping and a growing focus on cleaner marine fuels. The group operates vessels that move crude oil, dry bulk commodities, containers, chemicals, offshore wind components, and other cargoes. It also develops hydrogen and ammonia-related marine and industrial projects, which is where the “TECH” part of the name matters: management is trying to combine traditional shipping cash flows with exposure to lower-carbon transport solutions.
The business is still driven primarily by shipping. Based on the company’s recent reporting structure and public disclosures, revenue is spread across several shipping activities rather than one single market. Exact segment percentages can shift materially from year to year because freight rates are cyclical and asset transactions can affect reported revenue and profit. At a high level, the main sources of revenue are:
- Large marine transportation activities: tanker shipping, dry bulk shipping, and container-related operations together account for the clear majority of group revenue.
- Offshore and workboats: services linked to offshore energy and marine support.
- Chemicals and specialized shipping: transportation of chemical cargoes and other niche maritime services.
- Hydrogen and ammonia projects: still a smaller contributor today, but strategically important for future positioning.
CMB.TECH’s financial profile can look unusual because reported earnings may include vessel sales, revaluations, or other non-recurring maritime items. That means revenue gives only part of the picture; fleet value, charter rates, utilization, financing costs, and capital spending are also central to understanding the business.
The long-term shift visible in the company’s financial path is a move from heavy losses earlier in the decade to much stronger operating and net profitability more recently, although with meaningful volatility from one year to the next. That pattern is common in shipping, where market conditions can change quickly.
The broad trend shows a sharp turnaround from losses in 2021 to strong profitability in 2022 through 2024, followed by a weaker earnings mix in 2025 as financing costs and business volatility became more visible. Revenue has expanded materially over the period, but earnings quality remains tied to a cyclical industry rather than a smooth utility-like model.
Key Figures
| Metric | Value | Sector ⓘ |
|---|---|---|
| Date | Oct 17, 2026 | |
| Context | ||
| Sector | Energy | |
| Industry | Oil & Gas Midstream | |
| Market Cap ⓘ | $6.03B | |
| Beta ⓘ | 0.20 | |
Value (Cheapness) | ||
| P/E Ratio ⓘ | 7.02 | 15.44 |
| P/B Ratio ⓘ | 1.77 | 1.73 |
| FCF Yield ⓘ | 4.89% | 8.20% |
| Dividend Yield ⓘ | 3.85% | 3.59% |
| EBIT / EV ⓘ | 6.22% | 7.46% |
| PEG ⓘ | -3.43 | |
Growth (Business expansion) | ||
| Revenue Growth ⓘ | 81.50% | 26.90% |
| RPS Growth (5Y CAGR) ⓘ | 36.68% | 6.90% |
| EPS Growth (5Y CAGR) ⓘ | 31.31% | -15.73% |
| BVPS Growth (5Y CAGR) ⓘ | 4.17% | 6.07% |
| Margin Growth (5Y Trend) ⓘ | 89.84% | 0.58% |
| FCF Growth (5Y CAGR) ⓘ | N/A | 1.86% |
| DPS Growth (5Y CAGR) ⓘ | -6.57% | 16.79% |
Quality (Business durability) | ||
| ROIC (Latest) ⓘ | 8.00% | 11.40% |
| ROA (Latest) ⓘ | 9.73% | 6.06% |
| ROIC (5Y Median) ⓘ | 7.88% | 10.30% |
| ROA (5Y Median) ⓘ | 5.24% | 5.42% |
| Net Debt / EBIT (Latest) ⓘ | 7.82 | 1.64 |
| Net Debt / EBIT (5Y Median) ⓘ | 5.31 | 1.83 |
| Net Debt / EBITDA (Latest) ⓘ | 4.00 | 1.08 |
| Net Debt / Assets ⓘ | 60.05% | 17.29% |
| EBITDA / Interest ⓘ | 3.36 | 9.64 |
| Operating Margin (Latest) ⓘ | 30.05% | 16.27% |
| Operating Margin (5Y Median) ⓘ | 32.88% | 20.39% |
| Debt to Equity (Latest) ⓘ | 174.71% | 54.76% |
| Profit Margin (Latest) ⓘ | 37.15% | 8.82% |
| Free Cash Flow (Latest) ⓘ | $295.10M | |
Momentum (Price trend) | ||
| 3Y Return ⓘ | +60.11% | +67.38% |
| 12M Return (excl. last month) ⓘ | +121.61% | +49.19% |
| 6M Return ⓘ | +58.54% | +7.07% |
| Price vs. 200-Day MA ⓘ | +31.20% | +9.56% |
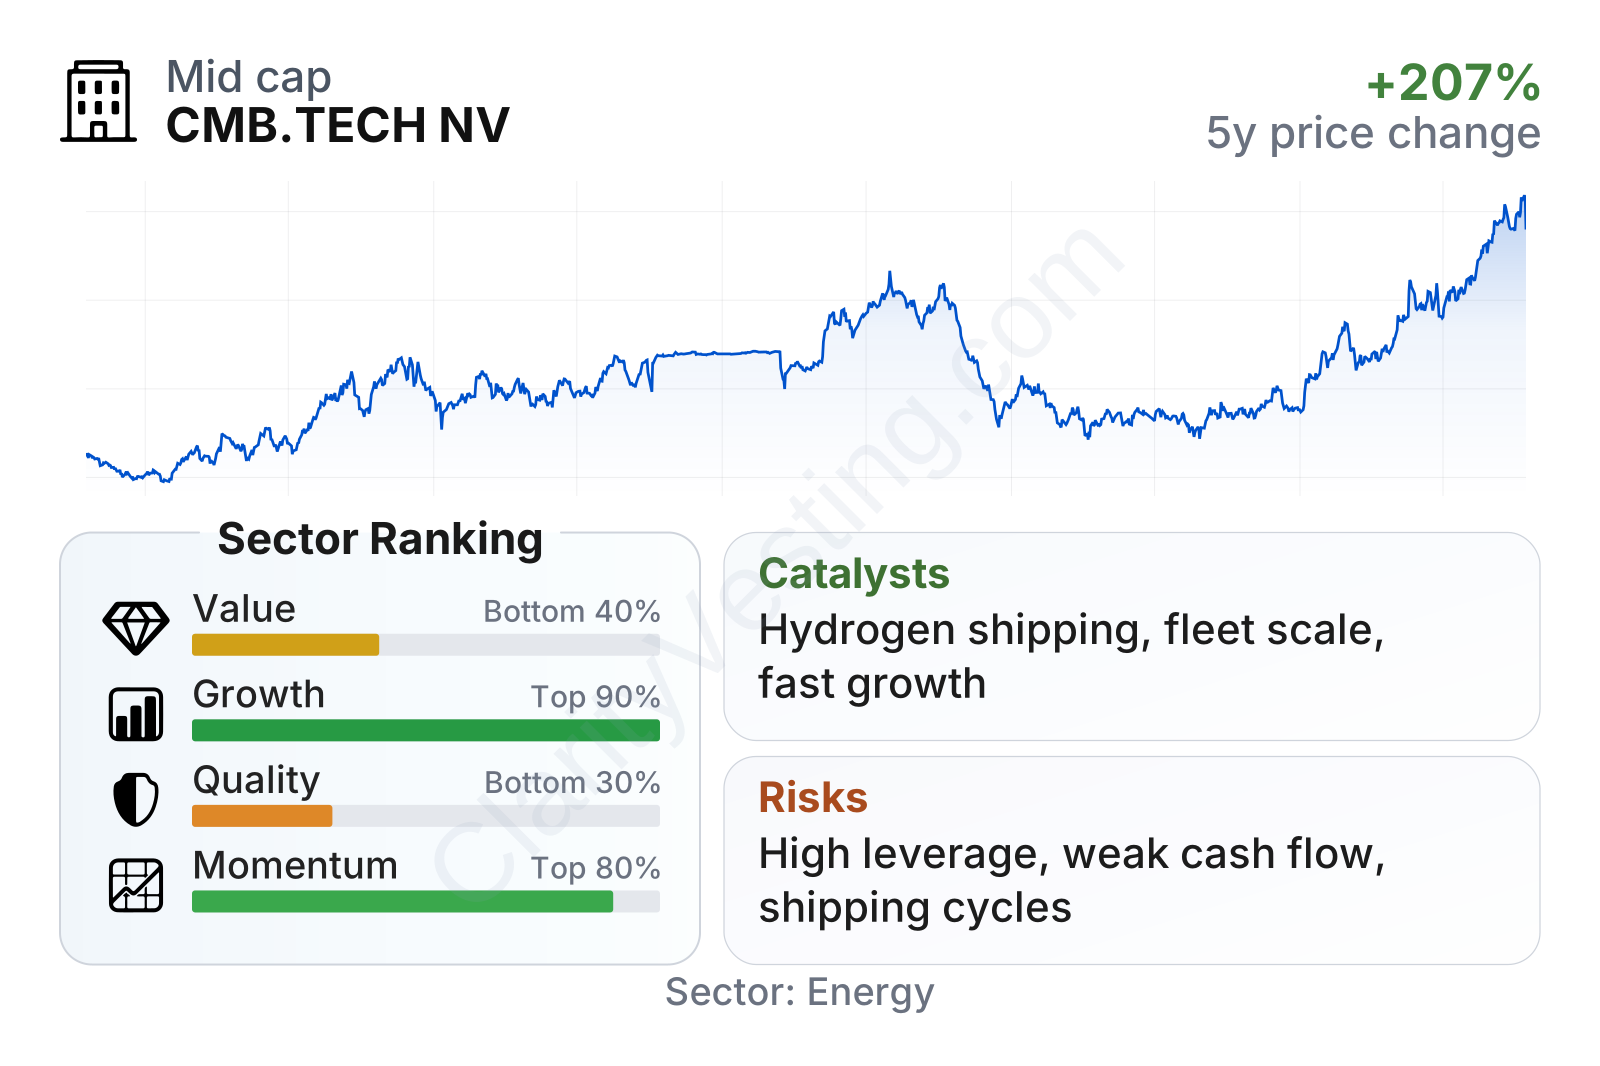
CMB.TECH is now a mid-sized listed company with a market value around the multi-billion-dollar range and a very low beta, although that low beta should not be read as low business risk because shipping results can still be highly cyclical. The table shows a mixed picture: growth and stock momentum are strong relative to the broader energy group, while value and quality rank weaker. The low earnings multiple stands out, but it comes with negative free cash flow, elevated leverage, and weaker balance-sheet metrics than many peers. Profitability margins are currently strong, yet the company’s overall profile remains less robust than those margins alone might suggest.
Growth
CMB.TECH operates in a sector with two different growth layers. The first is conventional shipping, which does not grow in a straight line but remains essential to global trade, energy supply, and commodity movements. The second is cleaner marine fuel infrastructure, where hydrogen and ammonia are receiving attention as potential long-term solutions for decarbonizing parts of shipping that are hard to electrify.
The company’s strategy makes industrial sense because it does not depend only on a distant energy-transition theme. It still owns and operates vessels in markets that generate current revenue, while using that base to build capabilities in alternative fuels. That dual model can be attractive when executed well: established shipping operations can provide scale, customer relationships, and technical know-how, while energy-transition projects create optionality for the next decade.
Recent revenue growth has been exceptionally strong versus the sector median, even though the path has been uneven. That matters because it suggests the business is expanding faster than many midstream and shipping-related peers, helped by acquisitions, fleet changes, and improved market exposure. Over five years, revenue per share and earnings per share have also compounded at a pace well above the sector median, indicating that the growth is not just a one-quarter effect.
The weaker point is cash generation. Free cash flow has swung between positive and negative territory and is currently negative again. For a capital-intensive shipping company, that often reflects vessel purchases, fleet renewal, or strategic investments rather than simple operating weakness. Still, it means growth is coming with cash demands, and the company needs that expansion to translate into durable returns over time.
A meaningful catalyst is the company’s continued positioning in hydrogen and ammonia-powered shipping applications. If regulation tightens and customers increasingly prioritize lower-emission transport, early movers with real vessels, fuel partnerships, and engineering experience could gain commercial advantages. Another catalyst is scale: in shipping, larger platforms can improve fleet deployment, customer access, financing reach, and resilience across market cycles.
Risks
This article is for informational purposes only and does not constitute financial advice. Some content is AI-generated. See Disclaimer


