Stock Analysis · Calumet Specialty Products Partners (CLMT)
Overview
Calumet Specialty Products Partners is an independent producer of specialty products and fuels. In simple terms, it refines and processes hydrocarbons into products that are used in everyday industrial and consumer applications, while also operating a fuels business and a developing renewable fuels platform. Its operations are more complex than a standard oil refiner because a meaningful part of the business is tied to specialty products with more customized formulations and customer relationships.
The company’s revenue mainly comes from selling refined petroleum-based products across a few major areas. Based on recent company reporting, the mix can shift with commodity prices and plant utilization, but the broad ranking is usually as follows:
- Performance Brands / Specialty Products: roughly 35% to 45% of revenue in recent periods. This includes lubricating oils, solvents, waxes, petrolatum, esters, packaged and blended products, and other specialty formulations used in industrial, automotive, personal care, and consumer applications.
- Montana/Renewables and related fuels sales: roughly 25% to 35%. This includes renewable diesel and related value streams tied to the Great Falls, Montana platform, which has become strategically important because renewable fuels can generate higher-margin credits in addition to product sales.
- Conventional fuels refining and marketing: roughly 20% to 30%. This includes gasoline, diesel, jet fuel, asphalt, and other fuel products sold through wholesale and commercial channels.
- Other and smaller activities: generally below 10%. This can include by-products, service-related revenue, and inter-segment items depending on the reporting period.
What matters most for long-term analysis is that Calumet is no longer only a traditional fuels processor. Management has been trying to reshape the company toward higher-value specialty products and cleaner fuels, especially through the Montana renewable diesel asset. That shift is central to understanding both the upside and the risk profile.
The financial flow over the last several years shows a business with very high raw material costs relative to revenue, which is normal in refining, but also a company whose profits have been highly sensitive to margin swings. Operating performance improved sharply in 2023, weakened again in 2024, and partially recovered in 2025, highlighting how dependent results remain on spread conditions, plant performance, and financing costs.
Key Figures
| Metric | Value | Sector ⓘ |
|---|---|---|
| Date | Oct 17, 2026 | |
| Context | ||
| Sector | Basic Materials | |
| Industry | Specialty Chemicals | |
| Market Cap ⓘ | $5.15B | |
| Beta ⓘ | 0.78 | |
Value (Cheapness) | ||
| P/E Ratio ⓘ | N/A | 16.90 |
| P/B Ratio ⓘ | N/A | 1.65 |
| FCF Yield ⓘ | 2.92% | 5.76% |
| Dividend Yield ⓘ | N/A | 2.13% |
| EBIT / EV ⓘ | -2.41% | 6.30% |
| PEG ⓘ | 0.65 | |
Growth (Business expansion) | ||
| Revenue Growth ⓘ | 40.80% | 11.10% |
| RPS Growth (5Y CAGR) ⓘ | 4.58% | 4.49% |
| EPS Growth (5Y CAGR) ⓘ | N/A | -13.47% |
| BVPS Growth (5Y CAGR) ⓘ | N/A | 5.51% |
| Margin Growth (5Y Trend) ⓘ | 5.63% | -1.54% |
| FCF Growth (5Y CAGR) ⓘ | N/A | 0.37% |
| DPS Growth (5Y CAGR) ⓘ | N/A | 6.08% |
Quality (Business durability) | ||
| ROIC (Latest) ⓘ | -0.64% | 9.26% |
| ROA (Latest) ⓘ | -4.94% | 4.91% |
| ROIC (5Y Median) ⓘ | 0.87% | 7.70% |
| ROA (5Y Median) ⓘ | -6.97% | 3.86% |
| Net Debt / EBIT (Latest) ⓘ | N/A | 1.40 |
| Net Debt / EBIT (5Y Median) ⓘ | 88.35 | 1.70 |
| Net Debt / EBITDA (Latest) ⓘ | 86.30 | 0.95 |
| Net Debt / Assets ⓘ | 76.67% | 13.69% |
| EBITDA / Interest ⓘ | 0.12 | 12.34 |
| Operating Margin (Latest) ⓘ | -3.63% | 13.20% |
| Operating Margin (5Y Median) ⓘ | 0.37% | 11.80% |
| Debt to Equity (Latest) ⓘ | -198.64% | 40.56% |
| Profit Margin (Latest) ⓘ | -2.98% | 6.43% |
| Free Cash Flow (Latest) ⓘ | $150.40M | |
Momentum (Price trend) | ||
| 3Y Return ⓘ | +236.63% | +68.89% |
| 12M Return (excl. last month) ⓘ | +225.19% | +30.21% |
| 6M Return ⓘ | +78.44% | -4.16% |
| Price vs. 200-Day MA ⓘ | +57.29% | -1.27% |
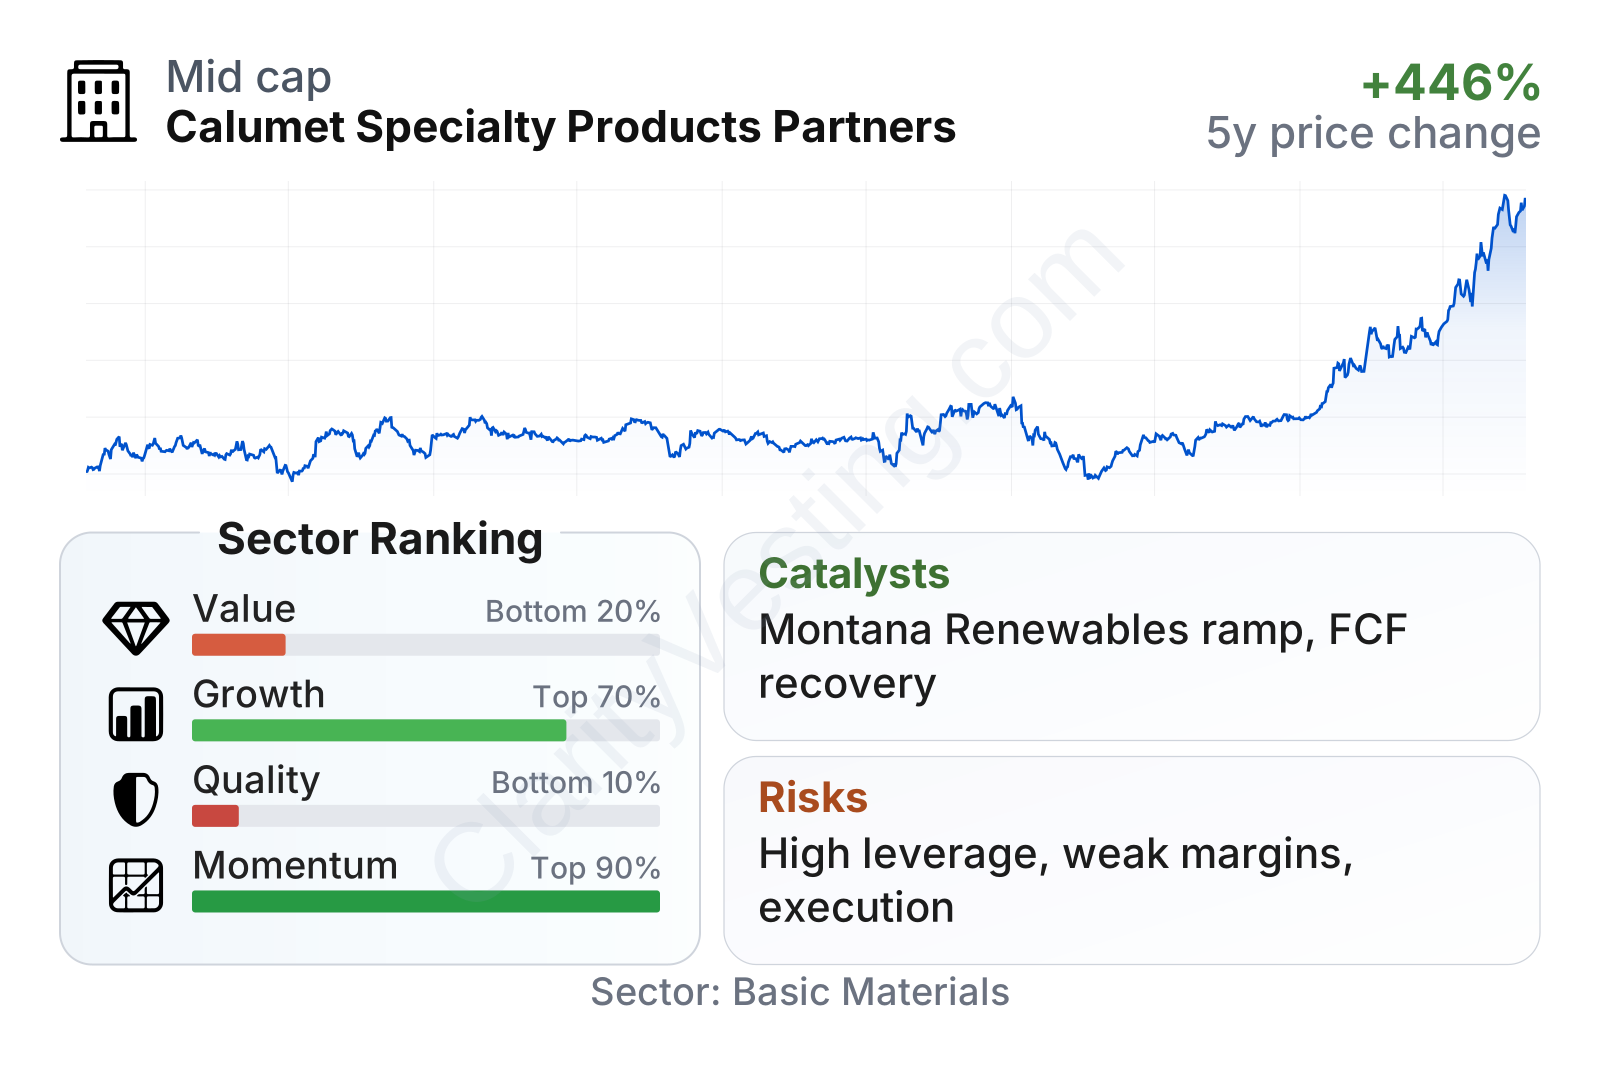
Calumet is now a mid-sized company by market value, and its stock has shown unusually strong momentum over the last year and over a three-year view. At the same time, the underlying fundamentals look mixed. Growth and market momentum rank better than much of the sector, but quality and balance-sheet measures remain among the weakest. That combination usually signals a company in transition: the market is recognizing a possible improvement path, while the financial statements still show meaningful stress.
The table also points to an important contrast. Revenue growth has recently been much faster than the sector median, and free cash flow has turned positive on a trailing basis. However, profitability ratios, returns on capital, and interest coverage remain far below normal sector levels. In other words, the equity market has responded to improving prospects faster than the income statement has improved.
Growth
Calumet operates in two areas that have different long-term outlooks. Conventional fuels are mature and cyclical, with growth mostly driven by refining margins, regional supply-demand balances, and operational execution rather than by steady structural expansion. Specialty products are more attractive because they tend to rely more on formulations, customer relationships, and niche applications. Renewable fuels add a third dimension: they are linked to decarbonization policy, low-carbon fuel demand, and government credit systems, which can create periods of strong earnings leverage.
The strategic logic is fairly clear. Management has been emphasizing specialty products for margin resilience and renewable diesel for long-term growth potential. The Montana Renewables platform is the most important catalyst in that plan. If the asset runs reliably and captures favorable renewable fuel economics, it can materially change Calumet’s earnings profile compared with its historical refining-centered model.
Revenue growth has been volatile rather than linear. After very strong growth in 2022, the company went through periods of contraction and then returned to strong year-over-year expansion in the most recent period, reaching roughly 41%, well above the sector median near 11%. That rebound suggests either a stronger operating base, improved product mix, or easier comparisons, but it also reinforces that Calumet’s top line can move sharply from one period to another.
Free cash flow is another area to watch closely. The company spent several periods with negative cash generation, which is common when operations are under pressure or when capital spending is elevated. The recent move back into positive territory is encouraging because it suggests that the business may be regaining self-funding capacity. For a company with meaningful debt, that matters more than revenue growth alone.
Recent company updates have also kept attention on Montana Renewables as a potentially significant opportunity. Public filings and company communications have emphasized financing initiatives, operational progress, and strategic interest in the renewable platform. The broader backdrop remains supportive as low-carbon fuel markets continue to attract capital and policy attention in North America, even though economics in that market can fluctuate significantly from quarter to quarter.
Risks
This article is for informational purposes only and does not constitute financial advice. Some content is AI-generated. See Disclaimer


