Stock Analysis · Celldex Therapeutics Inc (CLDX)
Overview
Celldex Therapeutics is a clinical-stage biotechnology company focused on developing medicines for inflammatory, allergic, and other immune-driven diseases, with additional oncology research. In simple terms, it is trying to create new drugs rather than selling a broad portfolio of approved products today. That makes Celldex different from large pharmaceutical companies: its value depends mainly on the progress of its research pipeline, especially the outcomes of clinical trials and the potential commercial opportunity of its lead programs.
The company’s current business model is still centered on research and development spending rather than recurring product sales. Revenue is therefore small, uneven, and largely non-core when compared with operating expenses. Based on recent reported results, revenue sources appear to be concentrated in collaboration-related and other operating revenue rather than sales of approved medicines.
Main revenue sources, from largest to smallest, are currently best understood as:
- Collaboration, licensing, and research-related revenue: likely the large majority of revenue when recognized; this can include payments linked to partnerships, research support, or milestone-related accounting.
- Other operating revenue: a smaller portion, typically made up of items not tied to commercial drug sales.
- Product revenue: currently negligible or absent, because Celldex does not yet operate as a large-scale commercial drug seller.
That structure matters for long-term analysis: the company is not being evaluated on stable sales today, but on whether its drug candidates can eventually become important treatments in sizable disease categories.
Over the last several years, operating spending has risen sharply as the pipeline has advanced, and research and development has been the clear use of capital. Revenue has remained modest by comparison, which is typical for a biotech company at this stage but also means the business is still far from self-funding.
The financial flow shows a business dominated by research spending. Development costs have climbed materially year after year, while revenue has stayed low and volatile. This reinforces that Celldex is currently financed for clinical progress, not for near-term earnings generation.
Key Figures
| Metric | Value | Sector ⓘ |
|---|---|---|
| Date | Oct 24, 2026 | |
| Context | ||
| Sector | Healthcare | |
| Industry | Biotechnology | |
| Market Cap ⓘ | $2.31B | |
| Beta ⓘ | 0.90 | |
Value (Cheapness) | ||
| P/E Ratio ⓘ | N/A | 25.42 |
| P/B Ratio ⓘ | 3.16 | 3.08 |
| FCF Yield ⓘ | -10.48% | 3.12% |
| Dividend Yield ⓘ | N/A | 1.85% |
| EBIT / EV ⓘ | -17.36% | 0.56% |
| PEG ⓘ | N/A | |
Growth (Business expansion) | ||
| Revenue Growth ⓘ | -97.00% | 7.50% |
| RPS Growth (5Y CAGR) ⓘ | -32.47% | 8.60% |
| EPS Growth (5Y CAGR) ⓘ | -1.10% | -17.73% |
| BVPS Growth (5Y CAGR) ⓘ | -5.13% | 3.72% |
| Margin Growth (5Y Trend) ⓘ | N/A | -0.57% |
| FCF Growth (5Y CAGR) ⓘ | N/A | 0.96% |
| DPS Growth (5Y CAGR) ⓘ | N/A | 6.69% |
Quality (Business durability) | ||
| ROIC (Latest) ⓘ | -40.84% | 3.17% |
| ROA (Latest) ⓘ | -42.02% | 2.98% |
| ROIC (5Y Median) ⓘ | -22.41% | 4.56% |
| ROA (5Y Median) ⓘ | -28.17% | 1.87% |
| Net Debt / EBIT (Latest) ⓘ | N/A | 1.34 |
| Net Debt / EBIT (5Y Median) ⓘ | N/A | 1.86 |
| Net Debt / EBITDA (Latest) ⓘ | N/A | 1.00 |
| Net Debt / Assets ⓘ | -5.44% | 5.06% |
| EBITDA / Interest ⓘ | N/A | 9.55 |
| Operating Margin (Latest) ⓘ | -268385.71% | 9.25% |
| Operating Margin (5Y Median) ⓘ | -2248.76% | 7.33% |
| Debt to Equity (Latest) ⓘ | 0.69% | 26.68% |
| Profit Margin (Latest) ⓘ | N/A | 3.34% |
| Free Cash Flow (Latest) ⓘ | -$241.82M | |
Momentum (Price trend) | ||
| 3Y Return ⓘ | +19.12% | +51.61% |
| 12M Return (excl. last month) ⓘ | +34.79% | +19.90% |
| 6M Return ⓘ | -15.32% | +10.10% |
| Price vs. 200-Day MA ⓘ | -11.02% | +6.44% |
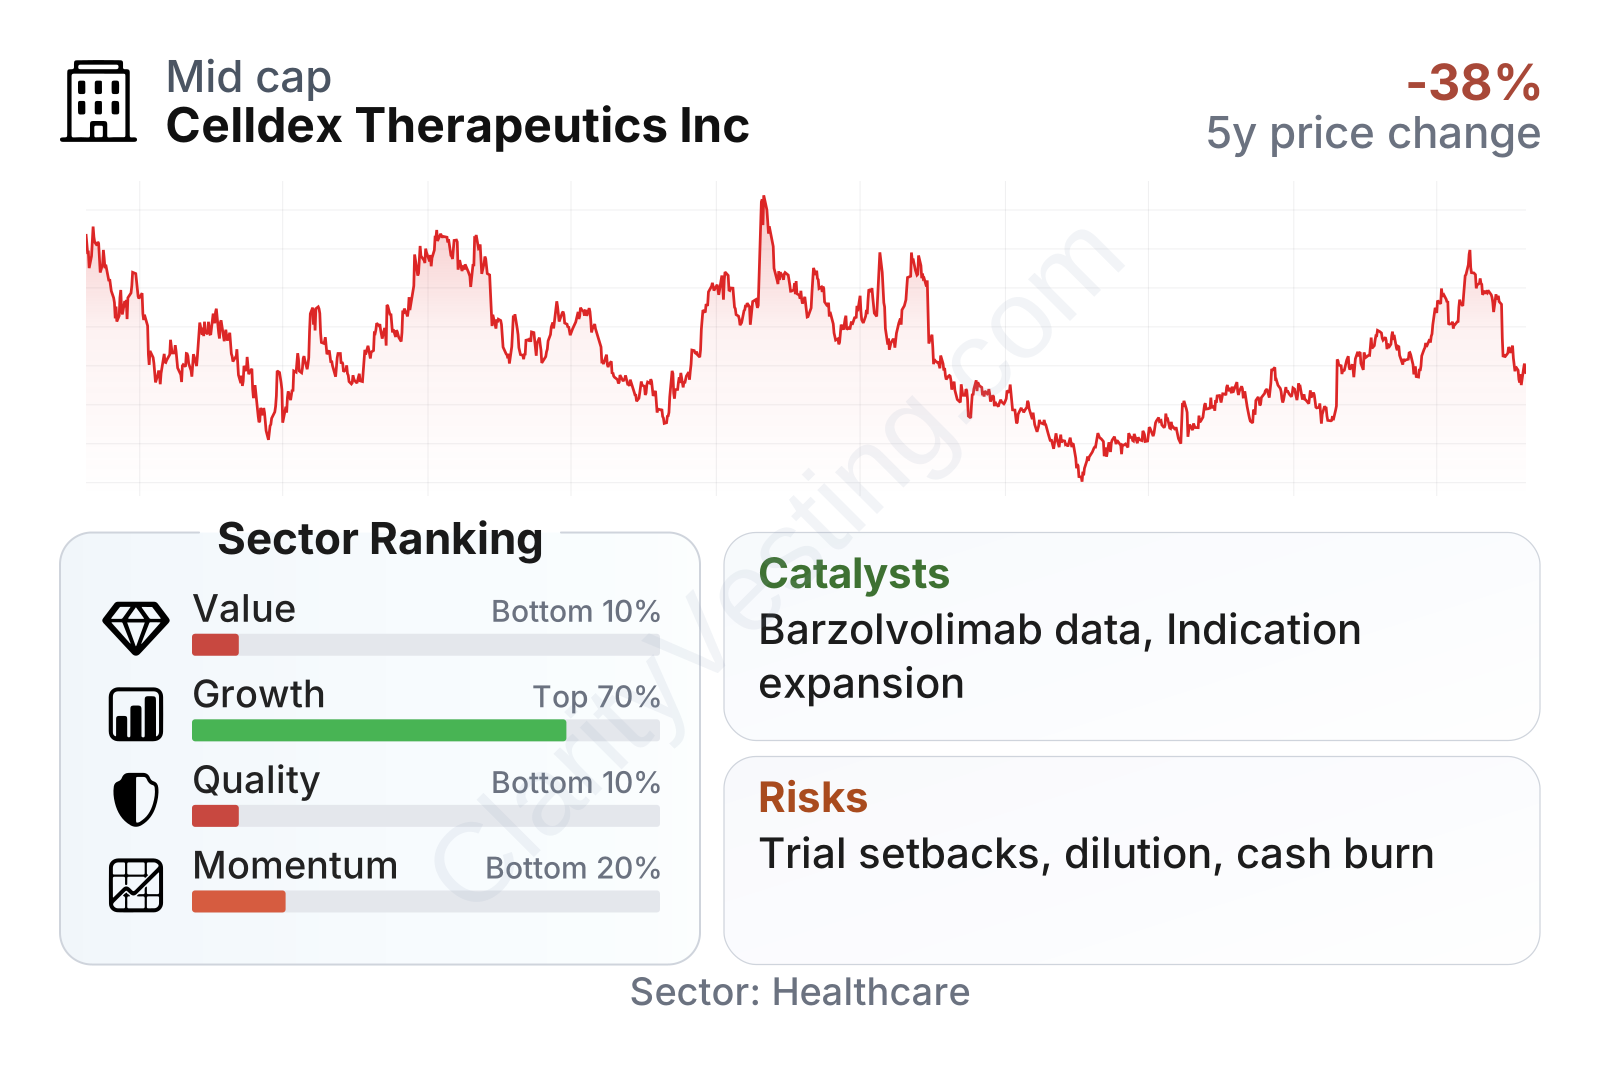
Celldex is a mid-sized biotechnology company by market value, with lower share-price volatility than many small biotech peers. The table points to a weak profile on traditional value and quality measures, which is not surprising for a company with minimal recurring revenue, negative cash flow, and no established product profits. Growth metrics are mixed rather than strong because reported revenue is not a good proxy for pipeline progress, while momentum has improved over the past year even if the longer record remains uneven.
The stock price history illustrates that the market has repeatedly re-priced the company based on clinical expectations. That pattern is common in development-stage biotech: valuation can move much faster than underlying revenue because the market is reacting to trial updates, not quarterly sales trends.
Growth
Celldex operates in a part of healthcare that continues to attract major industry interest: treatments for inflammatory and allergic diseases, especially areas with limited options for patients who do not respond well to existing therapies. This is a growing segment because chronic immune-related conditions are common, often require long-term treatment, and can support premium pricing if a drug shows meaningful clinical benefit and a manageable safety profile.
The company’s strategy is coherent for future growth. Instead of spreading resources across many unrelated projects, Celldex has increasingly emphasized programs aimed at diseases where biologic therapies can address clear unmet needs. Its lead asset, barzolvolimab, has been studied in mast cell-driven disorders such as chronic urticaria and other inflammatory conditions. If successful, that kind of program can create multiple expansion opportunities from one underlying mechanism, which is important for a company of Celldex’s size.
Reported revenue growth has been extremely volatile and should be interpreted carefully. For a clinical-stage biotech, swings in revenue often reflect the timing of collaboration accounting rather than real commercial traction. In Celldex’s case, the recent sharp declines mainly underline how little the current revenue base says about long-term earning power.
A more informative sign is the company’s willingness to keep increasing development spending behind its lead programs. Research expense has expanded significantly over time, indicating that management is pushing assets through larger and later-stage studies rather than conserving cash for appearance’s sake. That usually means more near-term losses, but it can also mean a more serious attempt to build future commercial value.
Free cash flow has become steadily more negative, reflecting that heavier trial activity is absorbing more cash. For Celldex, this is less a sign of weakening demand than a sign of pipeline investment. The key question is whether those cash outflows are supporting assets with sufficiently large market potential to justify the burn.
The strongest catalysts are clinical and regulatory. Positive data from late-stage or registrational studies, especially around barzolvolimab, could materially change how the market values the company. Additional signs of opportunity would include broader development into multiple indications, partnership interest from larger drugmakers, or a clearer route toward commercialization. Recent corporate updates have continued to highlight trial progression across mast cell-related diseases, which keeps the central growth thesis alive.
Risks
This article is for informational purposes only and does not constitute financial advice. Some content is AI-generated. See Disclaimer


