Stock Analysis · Clarkson PLC (CKNHF)
Overview
Clarkson PLC is a shipping services group based in the United Kingdom. Rather than operating a large fleet of ships itself, the company mainly acts as an intermediary, advisor, and service provider to shipowners, charterers, financial institutions, energy companies, and governments. Its activities cover shipbroking, research, financial advisory, port services, and technology tools used across global shipping and offshore markets.
This business model matters because Clarkson is tied more to activity levels in maritime trade, vessel transactions, offshore projects, and regulatory change than to the direct economics of owning ships. In practice, that can make the company more asset-light and less balance-sheet-intensive than shipowners, while still leaving earnings exposed to shipping cycles.
Based on the company’s reporting structure, revenue is mainly generated from four segments.
- Broking: about 75% to 80% of revenue. This is the core business and includes chartering vessels, sale and purchase brokerage, derivatives, and specialist broking across sectors such as dry bulk, tanker, container, gas, offshore, and renewables.
- Financial: about 10% to 15% of revenue. This segment includes corporate finance, project finance, restructuring advice, and investment banking services linked to shipping and offshore assets.
- Support: about 8% to 12% of revenue. This includes port agency and logistics services, helping vessels and cargoes move through ports and related operations.
- Research: about 2% to 4% of revenue. This covers market intelligence, data, analytics, and subscription-based research products used by shipping and capital-market participants.
The revenue mix can shift from year to year because broking activity depends on freight markets, vessel sales, offshore investment, and customer transaction volumes. Even so, Clarkson remains overwhelmingly a maritime services company with broking at the center.
Over the last five years, the company’s revenue rose from roughly $440 million to above $630 million, while operating income and net profit also improved versus 2021. The latest year was softer than the 2024 peak, but the broader picture still shows a business that has expanded through a favorable shipping cycle while preserving profitability.
The long-term pattern shows a business with high gross margins, which is typical for a service-heavy model, but also one where staff and administrative costs absorb a large share of revenue. That means Clarkson’s earnings power depends heavily on maintaining transaction volumes and pricing discipline rather than on manufacturing scale.
Key Figures
| Metric | Value | Sector ⓘ |
|---|---|---|
| Date | Oct 17, 2026 | |
| Context | ||
| Sector | Industrials | |
| Industry | Marine Shipping | |
| Market Cap ⓘ | $2.18B | |
| Beta ⓘ | 0.70 | |
Value (Cheapness) | ||
| P/E Ratio ⓘ | 21.09 | 22.10 |
| P/B Ratio ⓘ | 4.08 | 1.97 |
| FCF Yield ⓘ | 9.50% | 6.38% |
| Dividend Yield ⓘ | 1.61% | 1.94% |
| EBIT / EV ⓘ | N/A | 4.79% |
| PEG ⓘ | N/A | |
Growth (Business expansion) | ||
| Revenue Growth ⓘ | 38.90% | 9.30% |
| RPS Growth (5Y CAGR) ⓘ | 8.80% | 7.81% |
| EPS Growth (5Y CAGR) ⓘ | -29.18% | -13.06% |
| BVPS Growth (5Y CAGR) ⓘ | 9.54% | 6.14% |
| Margin Growth (5Y Trend) ⓘ | -3.27% | 0.88% |
| FCF Growth (5Y CAGR) ⓘ | -9.98% | 11.01% |
| DPS Growth (5Y CAGR) ⓘ | 7.40% | 9.48% |
Quality (Business durability) | ||
| ROIC (Latest) ⓘ | N/A | 10.84% |
| ROA (Latest) ⓘ | 16.15% | 5.41% |
| ROIC (5Y Median) ⓘ | 18.36% | 9.38% |
| ROA (5Y Median) ⓘ | 9.56% | 4.95% |
| Net Debt / EBIT (Latest) ⓘ | -1.35 | 2.08 |
| Net Debt / EBIT (5Y Median) ⓘ | -3.45 | 2.27 |
| Net Debt / EBITDA (Latest) ⓘ | -1.10 | 1.39 |
| Net Debt / Assets ⓘ | -27.45% | 19.28% |
| EBITDA / Interest ⓘ | 48.65 | 9.58 |
| Operating Margin (Latest) ⓘ | 14.46% | 10.50% |
| Operating Margin (5Y Median) ⓘ | 16.08% | 10.29% |
| Debt to Equity (Latest) ⓘ | 10.87% | 65.48% |
| Profit Margin (Latest) ⓘ | 10.40% | 6.67% |
| Free Cash Flow (Latest) ⓘ | $206.88M | |
Momentum (Price trend) | ||
| 3Y Return ⓘ | +136.54% | +61.68% |
| 12M Return (excl. last month) ⓘ | +45.68% | +12.58% |
| 6M Return ⓘ | +12.54% | 0.00% |
| Price vs. 200-Day MA ⓘ | +34.05% | +0.02% |
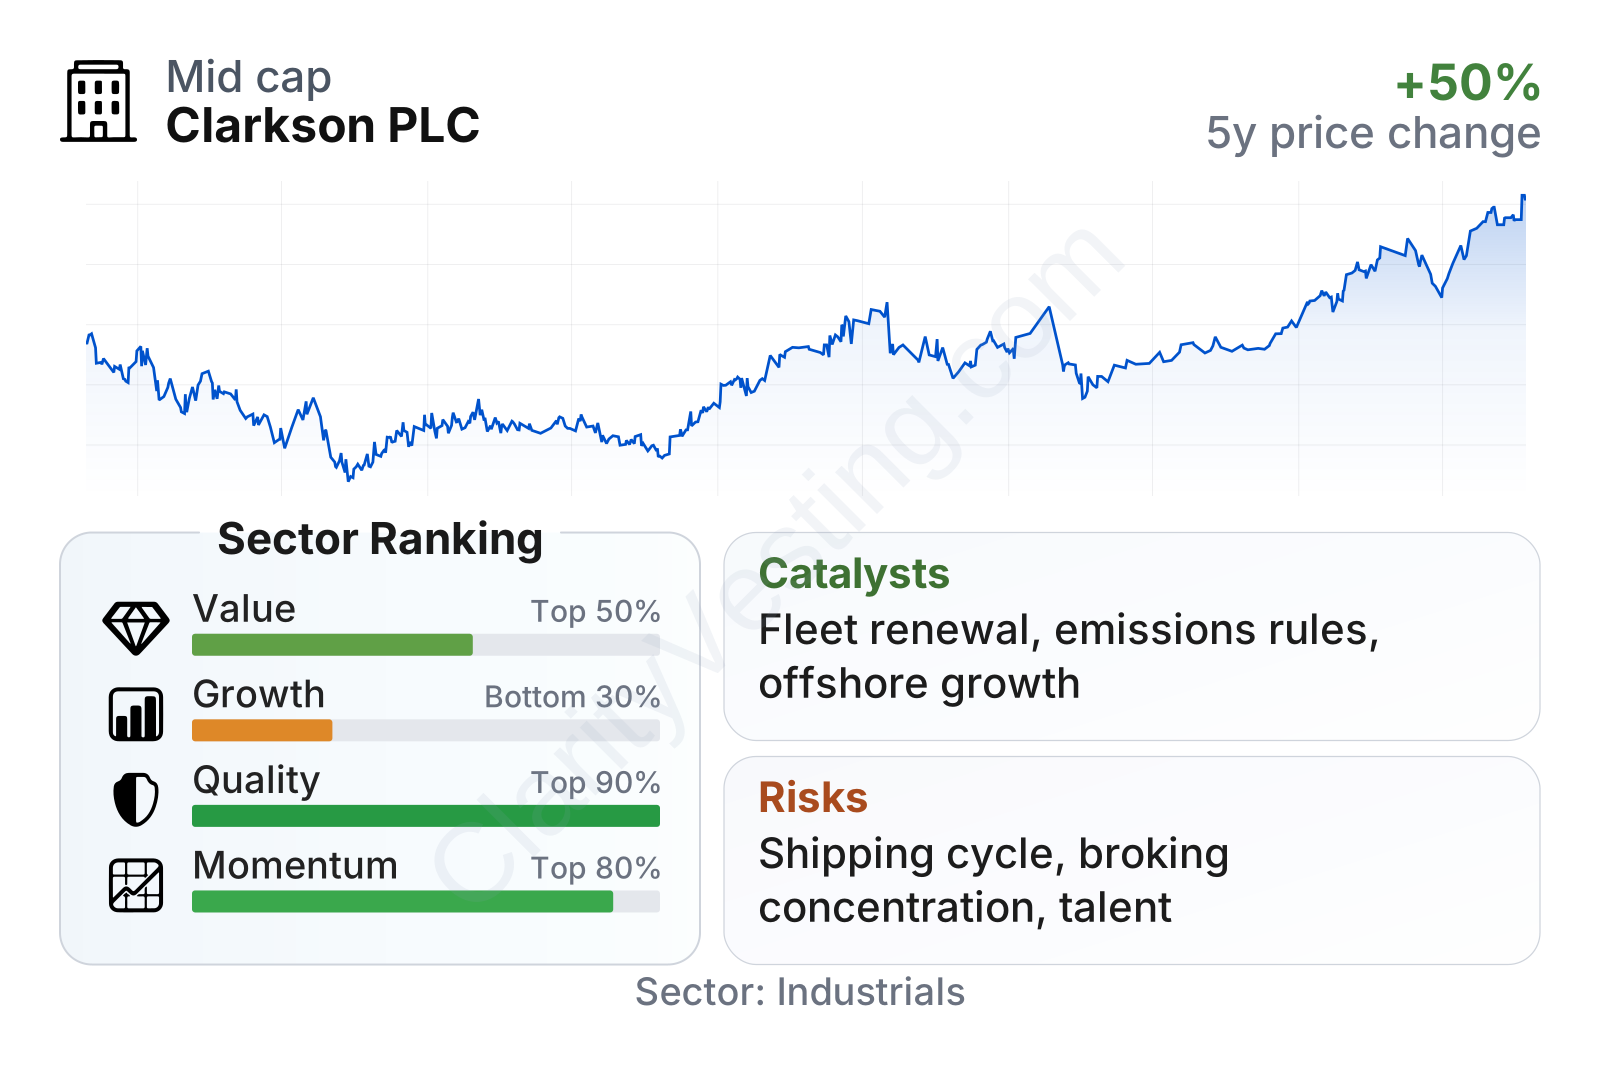
Clarkson stands out most clearly on quality and financial strength. Profitability is above the sector median, with operating margin in the mid-teens and profit margin around 10%. Returns on assets are also notably stronger than many industrial peers, while the balance sheet is unusually conservative: debt is low, interest coverage is very high, and net cash metrics indicate more cash than debt.
On value, the picture is more mixed. The earnings multiple is close to the sector median, but the price-to-book ratio is clearly higher, which suggests the market is willing to pay a premium for Clarkson’s franchise quality, balance sheet strength, and niche positioning. Free cash flow yield is healthy, which helps offset some of that richer asset-based valuation.
Growth indicators are less flattering than the recent share-price momentum. Revenue growth has been strong recently, but longer-term earnings and free cash flow trends have been less consistent, partly reflecting the cyclical nature of shipping markets. The stock’s market performance has nevertheless been strong over the last three years and still sits well above its longer-term trend line, showing that the market has been rewarding the company’s resilience and exposure to shipping strength.
Growth
Clarkson operates in a sector that is cyclical, but still supported by durable long-term demand drivers. Global trade continues to rely heavily on seaborne transport, and shipping markets are becoming more complex as fleets age, environmental rules tighten, fuel choices diversify, and offshore energy investment broadens. That complexity tends to favor specialized intermediaries with data, market reach, and execution capabilities.
Clarkson’s strategy is sensible for this environment. The company combines a global broking network with advisory, research, digital tools, and port services. This creates a broader platform than pure brokerage alone. Customers that first engage Clarkson for chartering or asset transactions can also use its market intelligence, financing advice, and operational support. That strengthens relationships and may help smooth some volatility across the cycle, even if it does not remove it.
One important catalyst is the ongoing energy transition in shipping. Stricter emissions rules, fleet renewal needs, and the shift toward cleaner fuels are increasing demand for vessel replacement, retrofits, technical advice, and asset transactions. Clarkson is active in segments such as offshore, renewables, and specialized shipping where these trends can create additional broking and advisory opportunities.
Another support factor is industry fragmentation. Shipping remains a global business with many private owners, operators, and financiers. Scale in relationships, data, and market intelligence therefore matters. Clarkson’s long operating history and broad office network give it an advantage when transaction activity rises, especially in more complicated cross-border deals or niche vessel categories.
Recent company reporting has also highlighted a solid order book and continued investment in digital capabilities and analytics. That matters because maritime clients increasingly need real-time intelligence on freight, asset values, regulations, emissions, and routing economics. Research and technology are still a small share of revenue, but they can strengthen the core franchise by making Clarkson more embedded in customer workflows.
Risks
This article is for informational purposes only and does not constitute financial advice. Some content is AI-generated. See Disclaimer


