Stock Analysis · CK Infrastructure Holdings Ltd (CKISY)
Overview
CK Infrastructure Holdings Ltd is a Hong Kong-based infrastructure owner and operator with assets spread across several countries. Rather than relying on one single utility system, the group owns interests in electricity distribution, gas distribution, water infrastructure, waste management, district heating, transmission assets, toll roads, and infrastructure-related investments. Its business model is built around long-life assets that tend to produce recurring cash flow, often under regulated or contracted frameworks.
For long-term analysis, one important point is that CK Infrastructure is not a pure regulated electric utility despite its sector label in many market databases. It is better understood as a diversified infrastructure platform. That diversification matters because it reduces dependence on one country, one regulator, or one asset class.
Based on the company’s latest annual disclosures, revenue is generated from a mix of infrastructure operations and infrastructure-related businesses across geographies. Exact percentages can vary by year and by accounting treatment, but the business is broadly organized around the following sources:
- United Kingdom infrastructure operations – a major contributor, including electricity distribution, gas distribution, water-related assets, rail-related activities, and other utility infrastructure.
- Australia infrastructure operations – a major contributor, mainly electricity distribution, gas assets, and transport or other infrastructure investments.
- Continental Europe, Canada, and New Zealand operations – meaningful but smaller contributors, covering energy, water, and other public-service infrastructure.
- Hong Kong and Mainland China infrastructure – a smaller share, including power and other local infrastructure interests.
- Waste management, district energy, and related service activities – smaller but strategically useful sources that broaden the portfolio beyond classic utility networks.
One feature that stands out is that accounting profit is much larger than reported revenue, which reflects the company’s investment structure. CK Infrastructure owns many assets through associated companies and joint ventures, so a large part of economic value shows up through share of results rather than through consolidated sales. That means headline revenue alone does not fully describe the business.
The multi-year operating flow also shows a declining consolidated revenue base, while reported earnings stayed high. This again suggests the company’s value comes less from selling large volumes directly and more from collecting income from mature infrastructure holdings.
The business mix points to a company that is closer to an infrastructure owner than a traditional utility operator. That distinction helps explain why its margins, cash generation, and balance sheet profile look unusual compared with many regulated utilities.
Key Figures
| Metric | Value | Sector ⓘ |
|---|---|---|
| Date | Oct 17, 2026 | |
| Context | ||
| Sector | Utilities | |
| Industry | Utilities - Regulated Electric | |
| Market Cap ⓘ | $20.95B | |
| Beta ⓘ | 0.69 | |
Value (Cheapness) | ||
| P/E Ratio ⓘ | 6.50 | 17.28 |
| P/B Ratio ⓘ | 0.14 | 1.51 |
| FCF Yield ⓘ | 16.91% | 0.65% |
| Dividend Yield ⓘ | 6.33% | 3.77% |
| EBIT / EV ⓘ | N/A | 5.01% |
| PEG ⓘ | 3.74 | |
Growth (Business expansion) | ||
| Revenue Growth ⓘ | 7.00% | 6.10% |
| RPS Growth (5Y CAGR) ⓘ | -11.06% | 3.87% |
| EPS Growth (5Y CAGR) ⓘ | N/A | -11.30% |
| BVPS Growth (5Y CAGR) ⓘ | 0.42% | 4.23% |
| Margin Growth (5Y Trend) ⓘ | -118.29% | 3.57% |
| FCF Growth (5Y CAGR) ⓘ | -8.59% | -8.84% |
| DPS Growth (5Y CAGR) ⓘ | 1.09% | 4.84% |
Quality (Business durability) | ||
| ROIC (Latest) ⓘ | 5.58% | 6.53% |
| ROA (Latest) ⓘ | 19.66% | 3.20% |
| ROIC (5Y Median) ⓘ | 5.79% | 5.95% |
| ROA (5Y Median) ⓘ | 4.84% | 2.75% |
| Net Debt / EBIT (Latest) ⓘ | -2.63 | 7.13 |
| Net Debt / EBIT (5Y Median) ⓘ | 1.90 | 7.23 |
| Net Debt / EBITDA (Latest) ⓘ | -2.44 | 4.31 |
| Net Debt / Assets ⓘ | -12.91% | 38.42% |
| EBITDA / Interest ⓘ | 7.29 | 4.58 |
| Operating Margin (Latest) ⓘ | 97.27% | 20.83% |
| Operating Margin (5Y Median) ⓘ | 135.13% | 20.08% |
| Debt to Equity (Latest) ⓘ | 21.14% | 137.69% |
| Profit Margin (Latest) ⓘ | 509.08% | 11.37% |
| Free Cash Flow (Latest) ⓘ | $3.54B | |
Momentum (Price trend) | ||
| 3Y Return ⓘ | +97.05% | +52.37% |
| 12M Return (excl. last month) ⓘ | +31.93% | +8.84% |
| 6M Return ⓘ | +1.01% | -3.95% |
| Price vs. 200-Day MA ⓘ | +32.88% | -0.79% |
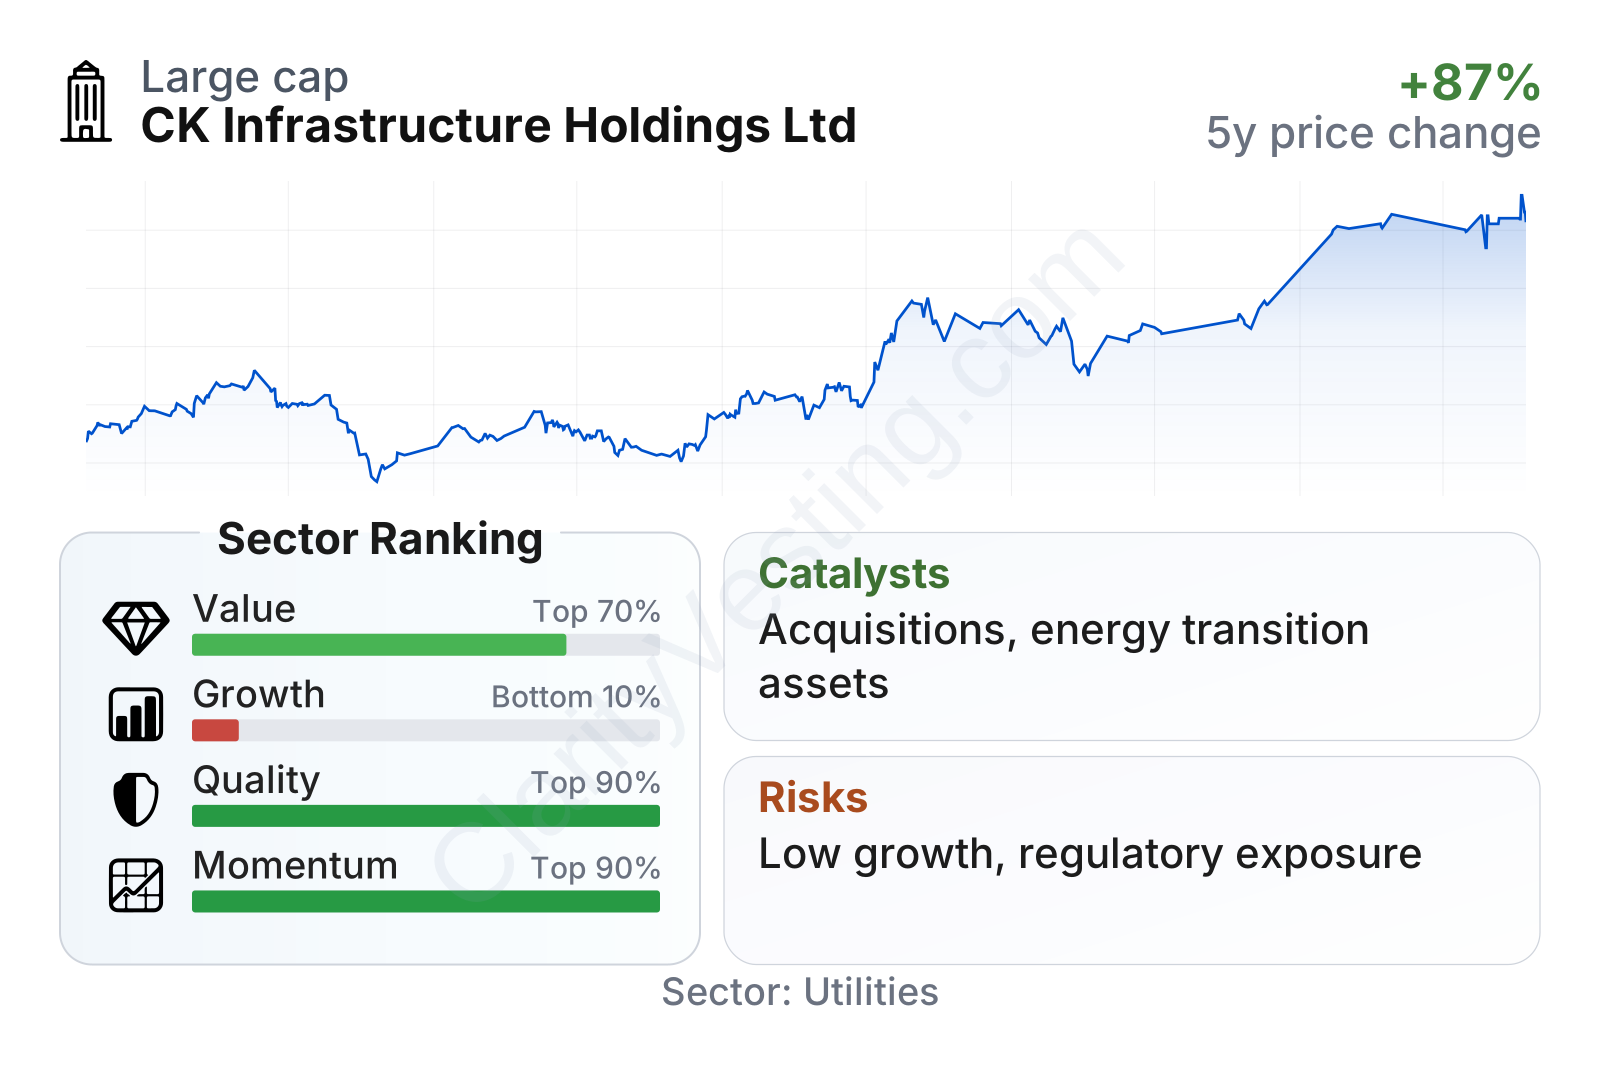
CK Infrastructure is a large infrastructure company with a market value above $20 billion and a relatively low beta, which fits the defensive reputation of utility-like assets. On valuation measures, it screens as inexpensive versus the sector median, with a low earnings multiple, a very low price-to-book ratio, a free cash flow yield far above most peers, and a dividend yield above the sector norm.
Quality metrics are especially strong. Leverage is much lower than typical utilities, interest coverage is solid, and profitability measures are unusually high. Momentum is also strong, with share-price performance over one, three, and long-term moving-average periods ahead of many sector peers.
The weaker area is growth. Revenue per share has declined over the last five years, book value growth has been modest, and margin trends over that same period have become less favorable despite still-high absolute profitability. In short, the company currently looks more like a cash-generative mature infrastructure owner than a fast-growing utility platform.
Growth
CK Infrastructure operates in a sector with long-term structural relevance. Electricity networks, gas systems, water assets, and environmental infrastructure remain essential services, and many countries continue to invest in grid resilience, energy transition, and replacement of aging infrastructure. Those themes create a supportive backdrop even if growth is usually slower than in technology or consumer sectors.
The company’s strategy has generally been consistent for many years: acquire high-quality infrastructure assets, operate them conservatively, and use a diversified portfolio to smooth country-specific or asset-specific volatility. For a long-duration business, that logic makes sense. Scale, asset life, and regulation can all create durable cash generation when assets are bought at disciplined prices.
The main limitation is that recent growth has not been broad-based. Revenue per share has trended downward over the past several years, showing that the business has not been expanding its top line in a straightforward way.
That pattern does not automatically mean deterioration, because CK Infrastructure’s structure causes earnings and cash flow to matter more than revenue. Still, for long-term compounding, a shrinking revenue-per-share trend deserves attention. It suggests future growth will likely need to come from acquisitions, regulatory asset-base expansion, tariff resets, or improved returns from existing holdings rather than from simple volume growth.
Cash generation is a more encouraging area. Free cash flow has been strong and appears to have improved meaningfully in the most recent periods shown.
Strong free cash flow is important because it gives the company room to fund dividends, reduce debt, and pursue new projects or acquisitions when infrastructure valuations become attractive. In this industry, financial flexibility can be a real growth advantage, especially when competitors are more heavily levered.
As for catalysts, the most credible ones are portfolio optimization, new infrastructure investments, and continued investment in energy-transition-related assets such as power networks and grid-supporting infrastructure. Management has historically focused on disciplined capital allocation, so periods of market stress can create opportunities for a buyer with liquidity and patience. If regulated returns remain stable and the company keeps deploying capital into essential infrastructure, moderate long-term expansion remains plausible even without rapid organic growth.
Risks
This article is for informational purposes only and does not constitute financial advice. Some content is AI-generated. See Disclaimer


