Stock Analysis · CK Hutchison Holdings Limited (CKHUF)
Overview
CK Hutchison Holdings Limited is a Hong Kong-based conglomerate with operations spread across ports, retail, infrastructure, telecommunications, and finance and investments. In simple terms, it owns a collection of large businesses that provide essential services and consumer products in many countries. Its footprint is especially broad in Europe and Asia, and that diversification is one of the company’s defining characteristics.
The group’s revenue comes from several very different activities, which helps reduce dependence on any single market. Based on the latest annual reporting, the business mix is approximately:
- Retail: about 65% to 70% of revenue. This includes health and beauty chains, supermarkets, and other consumer retail formats under banners such as A.S. Watson.
- Telecommunications: about 15% to 20% of revenue. This covers mobile and related telecom services in Europe and other markets.
- Ports and related services: about 5% to 10% of revenue. These operations handle container terminals and logistics infrastructure across multiple countries.
- Infrastructure: about 5% to 10% of revenue. This segment includes regulated or contracted assets such as energy, transportation, water, and utility-related businesses.
- Finance & investments and others: a small share of revenue. This area includes treasury activities, listed interests, and miscellaneous holdings.
That revenue mix does not fully capture economic importance. Infrastructure and ports often contribute a larger share of profit and cash generation than their revenue weight suggests because these businesses can have steadier margins than retail.
The business remains very large in scale, but it is not a pure-play company. Anyone studying it is really analyzing a portfolio of businesses under one corporate umbrella, with some units tied to consumer spending and others tied to trade flows, mobile usage, and regulated infrastructure demand.
Over the last several years, revenue has stayed broadly stable around a high level, but profit conversion has been more uneven. Operating income and net income have moved around much more than sales, which is a reminder that the group’s complexity, mix shifts, financing costs, and one-off items can materially affect reported earnings.
Key Figures
| Metric | Value | Sector ⓘ |
|---|---|---|
| Date | Oct 10, 2026 | |
| Context | ||
| Sector | Industrials | |
| Industry | Conglomerates | |
| Market Cap ⓘ | $32.90B | |
| Beta ⓘ | 0.75 | |
Value (Cheapness) | ||
| P/E Ratio ⓘ | 6.82 | 22.32 |
| P/B Ratio ⓘ | 0.07 | 1.98 |
| FCF Yield ⓘ | 268.30% | 6.34% |
| Dividend Yield ⓘ | 27.33% | 1.95% |
| EBIT / EV ⓘ | N/A | 4.71% |
| PEG ⓘ | 0.43 | |
Growth (Business expansion) | ||
| Revenue Growth ⓘ | -1.90% | 9.25% |
| RPS Growth (5Y CAGR) ⓘ | 0.04% | 7.75% |
| EPS Growth (5Y CAGR) ⓘ | -34.34% | -13.37% |
| BVPS Growth (5Y CAGR) ⓘ | -3.83% | 6.12% |
| Margin Growth (5Y Trend) ⓘ | -1.74% | 0.81% |
| FCF Growth (5Y CAGR) ⓘ | 36.72% | 11.01% |
| DPS Growth (5Y CAGR) ⓘ | -2.91% | 9.48% |
Quality (Business durability) | ||
| ROIC (Latest) ⓘ | 6.73% | 10.70% |
| ROA (Latest) ⓘ | 4.02% | 5.38% |
| ROIC (5Y Median) ⓘ | 3.62% | 9.26% |
| ROA (5Y Median) ⓘ | 2.04% | 4.94% |
| Net Debt / EBIT (Latest) ⓘ | 1.96 | 2.08 |
| Net Debt / EBIT (5Y Median) ⓘ | 6.88 | 2.29 |
| Net Debt / EBITDA (Latest) ⓘ | 0.93 | 1.43 |
| Net Debt / Assets ⓘ | 11.93% | 19.34% |
| EBITDA / Interest ⓘ | N/A | 9.54 |
| Operating Margin (Latest) ⓘ | 12.53% | 10.34% |
| Operating Margin (5Y Median) ⓘ | 11.64% | 10.29% |
| Debt to Equity (Latest) ⓘ | 54.80% | 65.52% |
| Profit Margin (Latest) ⓘ | 13.62% | 6.63% |
| Free Cash Flow (Latest) ⓘ | $88.27B | |
Momentum (Price trend) | ||
| 3Y Return ⓘ | +206.05% | +61.33% |
| 12M Return (excl. last month) ⓘ | +40.54% | +14.82% |
| 6M Return ⓘ | +16.20% | +3.53% |
| Price vs. 200-Day MA ⓘ | +16.51% | +0.88% |
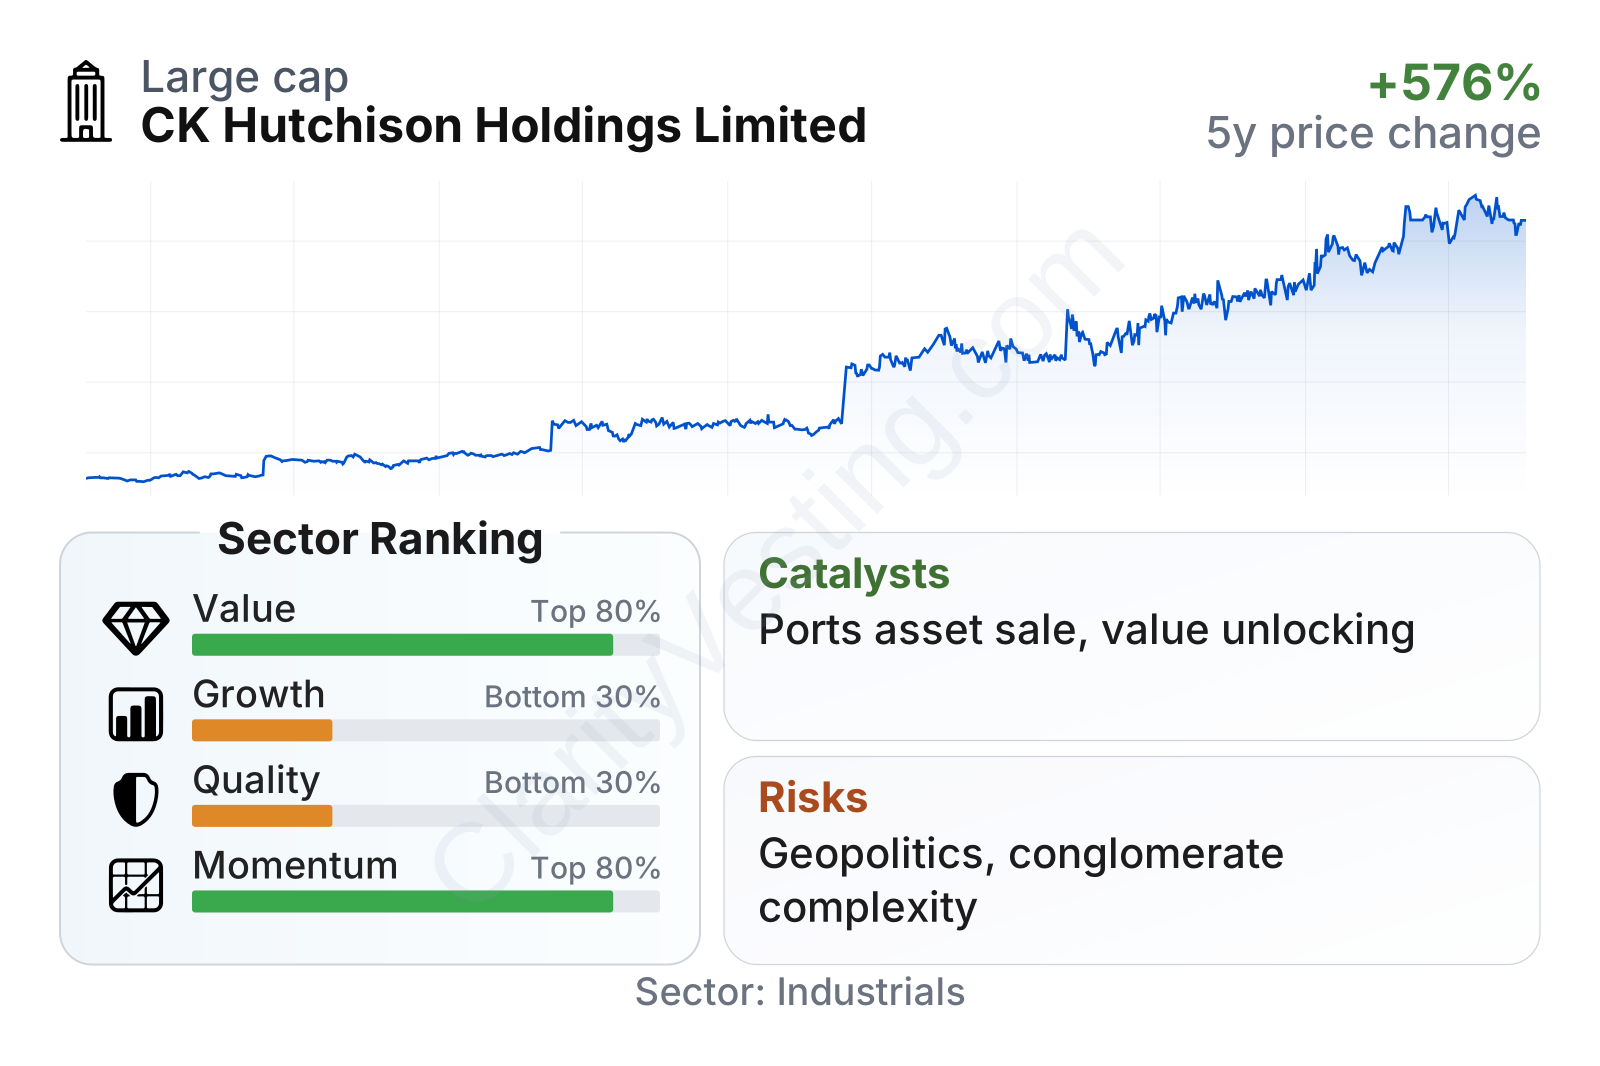
The stock has shown strong multi-year price momentum, clearly ahead of the broader industrial sector, while the company still screens as inexpensive on common valuation measures. At the same time, the operating profile is mixed: profitability margins are solid and debt appears manageable relative to assets and EBITDA, but return on capital and long-term earnings growth rank below many sector peers. In short, the market is recognizing value and cash generation, but the weaker growth and quality rankings show why the discount has not disappeared.
Another notable point is the combination of a low beta and strong recent share performance. That is relatively unusual and suggests the re-rating has come more from changing views on the company’s underlying assets and corporate actions than from broad market speculation alone.
Growth
CK Hutchison operates in a mix of sectors, and some are more attractive than others for long-term expansion. Telecommunications and infrastructure generally benefit from recurring demand, while ports are tied to global trade and retail depends more directly on consumer sentiment. This means the company is not positioned in a single fast-growing area, but rather in several large, durable markets that can still support moderate long-term expansion.
The clearest strategic angle for future growth has been portfolio reshaping rather than aggressive organic expansion. Management has historically recycled capital, sold or restructured assets, and allocated funds across businesses and geographies. For a conglomerate like CK Hutchison, value creation can come not only from business growth, but also from simplifying the structure, monetizing mature assets, and redirecting capital toward higher-return uses.
A major recent catalyst is the proposed transaction involving Hutchison Ports interests near the Panama Canal. In 2025, the company announced an agreement in principle to sell selected global ports assets, including the Panama ports business, to a consortium led by BlackRock and Terminal Investment Limited, while excluding ports in Hong Kong, Shenzhen, and South China. If completed on the planned scale, the deal would materially reshape the portfolio, potentially unlock capital, and increase balance sheet flexibility. It could also sharpen the market’s focus on the value of the remaining businesses.
There is also a broader sector backdrop that is supportive in parts of the portfolio. Mobile data usage keeps rising, health and beauty retail remains relevant in everyday consumer spending, and essential infrastructure assets typically retain long-term demand. These are not explosive growth drivers, but they can support resilience and recurring cash flow over time.
Still, recent reported growth has been modest to negative in several headline measures. Revenue growth has slightly lagged the sector, and five-year earnings trends have been weak. So the growth case depends less on rapid expansion and more on better capital allocation, improved business mix, and the possibility that asset values become more visible.
Risks
This article is for informational purposes only and does not constitute financial advice. Some content is AI-generated. See Disclaimer


