Stock Analysis · Cincinnati Financial Corporation (CINF)
Overview
Cincinnati Financial Corporation is a property and casualty insurer. Through its main subsidiary, The Cincinnati Insurance Company, it sells business, home, auto, and life insurance, while also managing an investment portfolio made up largely of bonds and equities. The company is best known for its agency-centered model: it distributes products through a network of independent insurance agencies rather than relying on direct-to-consumer sales.
Its revenue mix can move meaningfully from year to year because insurance companies report both underwriting-related revenue and investment-related gains or losses. Based on recent annual reporting, the business is still primarily driven by property casualty insurance premiums, with investment income providing an important second source and life insurance remaining a smaller contributor.
- Property casualty insurance earned premiums: about 70% to 80% of total revenue in recent years. This includes commercial lines, personal lines, and excess and surplus lines, and it is the core operating engine of the company.
- Investment income: about 10% to 15%. This mainly comes from interest on bonds and dividends from equity holdings.
- Net investment gains: highly variable, often 5% to 15% over time, depending on market conditions. This can materially lift or depress reported results from one year to the next.
- Life insurance earned premiums: about 2% to 4%. This is a smaller business line compared with the property casualty segment.
Cincinnati Financial is a large insurer, but not the dominant player in U.S. property and casualty insurance. Its niche is built around long-standing agency relationships, disciplined underwriting, and a relatively strong balance sheet.
The long-term pattern shows how cyclical reported earnings can be for an insurer. Revenue and operating profit rebounded strongly after the weak 2022 period, helped by firmer pricing, better underwriting conditions, and the recovery of investment-related results.
Key Figures
| Metric | Value | Sector ⓘ |
|---|---|---|
| Date | Oct 03, 2026 | |
| Context | ||
| Sector | Financial Services | |
| Industry | Insurance - Property & Casualty | |
| Market Cap ⓘ | $24.46B | |
| Beta ⓘ | 0.55 | |
Value (Cheapness) | ||
| P/E Ratio ⓘ | 7.52 | 12.60 |
| P/B Ratio ⓘ | 1.52 | 1.23 |
| FCF Yield ⓘ | 13.96% | 10.16% |
| Dividend Yield ⓘ | 2.25% | 2.96% |
| EBIT / EV ⓘ | 17.48% | 7.77% |
| PEG ⓘ | 2.19 | |
Growth (Business expansion) | ||
| Revenue Growth ⓘ | 31.60% | 9.50% |
| RPS Growth (5Y CAGR) ⓘ | 7.86% | 12.10% |
| EPS Growth (5Y CAGR) ⓘ | -4.71% | -9.45% |
| BVPS Growth (5Y CAGR) ⓘ | 5.78% | 5.01% |
| Margin Growth (5Y Trend) ⓘ | -14.96% | -4.07% |
| FCF Growth (5Y CAGR) ⓘ | 11.99% | 4.96% |
| DPS Growth (5Y CAGR) ⓘ | 8.21% | 8.79% |
Quality (Business durability) | ||
| ROIC (Latest) ⓘ | N/A | 9.60% |
| ROE (Latest) ⓘ | 20.74% | 13.84% |
| ROA (Latest) ⓘ | 7.96% | 1.53% |
| ROIC (5Y Median) ⓘ | 15.48% | 7.86% |
| ROE (5Y Median) ⓘ | 16.27% | 12.20% |
| ROA (5Y Median) ⓘ | 6.18% | 1.29% |
| Net Debt / EBIT (Latest) ⓘ | -0.21 | 0.91 |
| Net Debt / EBIT (5Y Median) ⓘ | -0.05 | 0.74 |
| Net Debt / EBITDA (Latest) ⓘ | -0.20 | 0.97 |
| Operating Margin (Latest) ⓘ | 30.16% | 22.12% |
| Operating Margin (5Y Median) ⓘ | 24.01% | 24.39% |
| Debt to Equity (Latest) ⓘ | 5.25% | 60.37% |
| Profit Margin (Latest) ⓘ | 23.84% | 26.62% |
| Free Cash Flow (Latest) ⓘ | $3.41B | |
Momentum (Price trend) | ||
| 3Y Return ⓘ | +74.27% | +89.23% |
| 12M Return (excl. last month) ⓘ | +13.42% | +17.35% |
| 6M Return ⓘ | +4.00% | +10.00% |
| Price vs. 200-Day MA ⓘ | -2.12% | +3.73% |
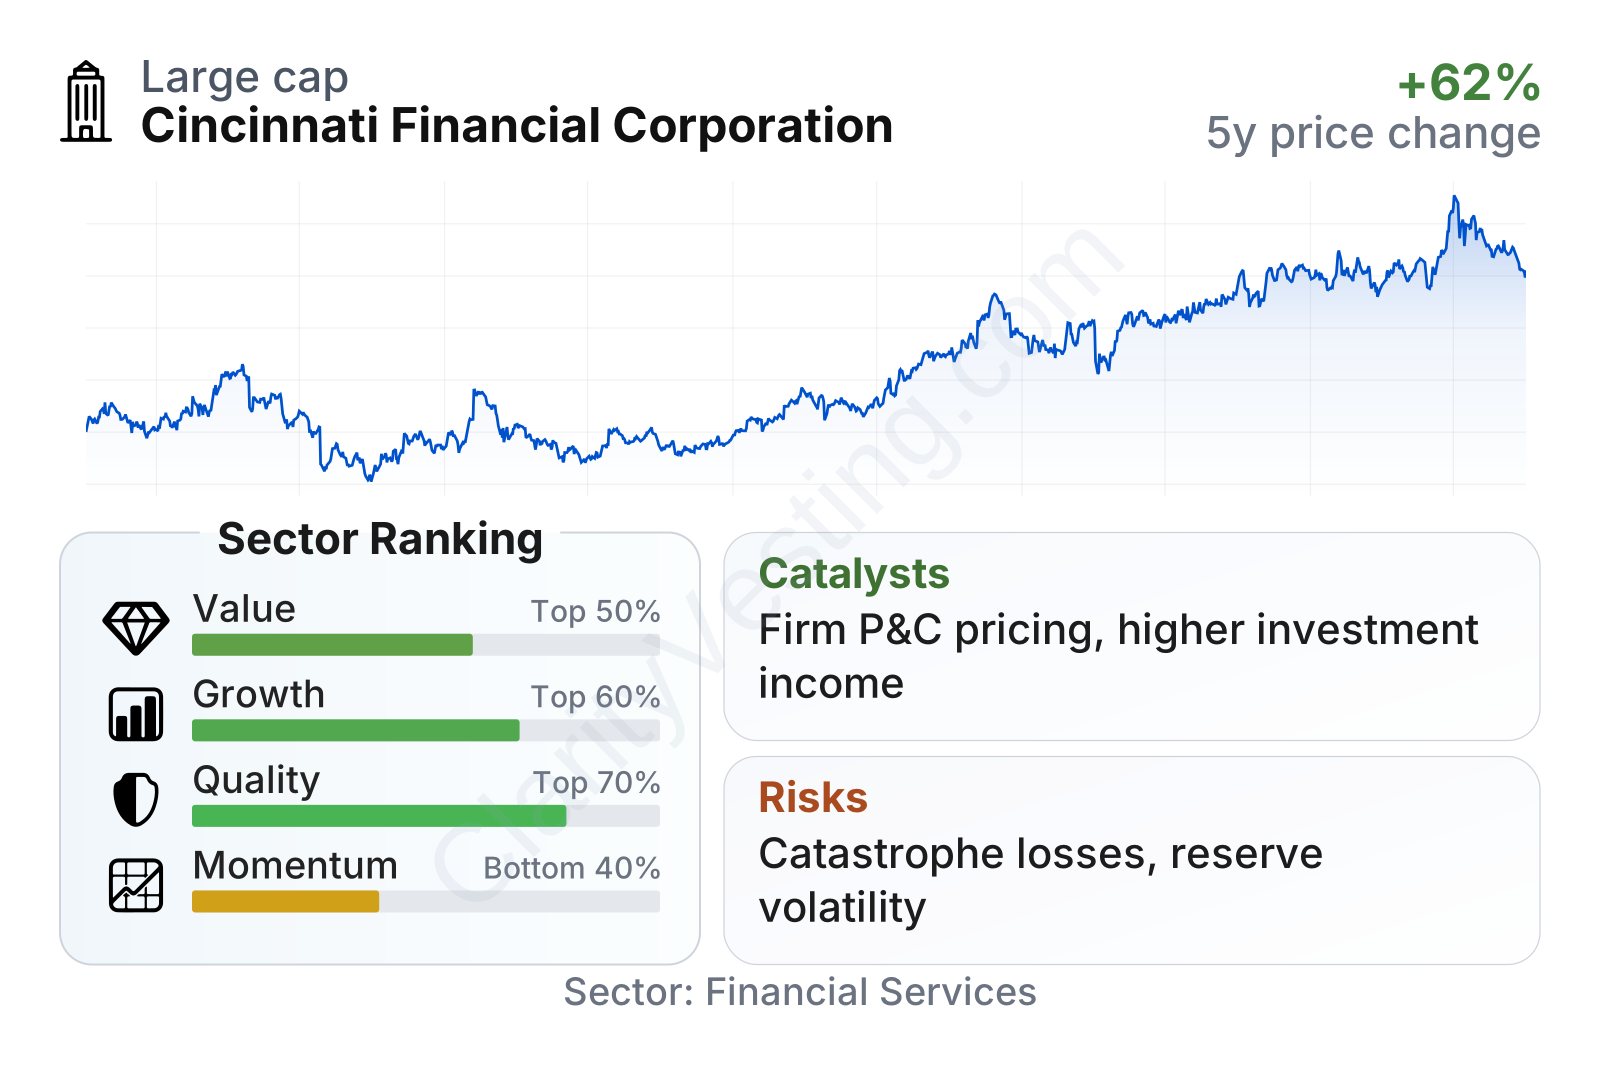
The overall profile is mixed but understandable. Valuation measures based on earnings look moderate relative to the sector, while price-to-book sits somewhat above the industry median. Quality is stronger than average, with profitability and balance-sheet metrics standing out, but recent share-price momentum has lagged much of the financial sector. The stock has also shown relatively low volatility, as reflected by a beta well below 1.
The share-price history shows a business that went through a sharp reset in 2022 and then recovered steadily. That pattern fits the economics of insurance: performance can swing with catastrophe losses, reserve development, and investment markets, but stronger pricing and compounding book value often matter more than any single year.
Growth
Property and casualty insurance is not a fast-growth industry in the way software or semiconductors can be, but it is a durable sector with recurring demand. Businesses and households continue to need coverage, and inflation often pushes insured values higher over time. That creates a steady base for premium growth, especially when insurers are able to reprice policies after periods of elevated claims.
Cincinnati Financial’s strategy appears coherent for this environment. The company keeps a strong focus on independent agents, targets selected commercial and personal lines, and supports growth with a sizable investment portfolio. In a favorable pricing cycle, this model can expand premiums while also benefiting from higher reinvestment yields on bonds. That combination has been important recently across the insurance industry.
Recent operating trends support the growth case, although not in a perfectly smooth way. Revenue growth has been well ahead of the sector median over the last year, and free cash flow growth over five years has also been strong. At the same time, five-year revenue-per-share growth has been more moderate, which suggests this is not a pure high-growth compounder but rather a company benefiting from underwriting conditions and capital accumulation.
Earnings per share have been volatile, which is normal for insurers with meaningful exposure to catastrophe losses and investment-market movements. The recovery after 2022 was significant, with earnings rebounding strongly in 2023 and especially 2024 before easing again. For long-term analysis, the more useful takeaway is that profitability has recovered well rather than expecting a straight-line earnings trend.
Book value per share is especially important for insurers because it captures retained profits and changes in investment values. Here, the trend is constructive. After the decline in 2022, book value has rebuilt decisively and reached new highs by 2025. That matters because book value growth is one of the clearest signs that an insurer is creating capital over time.
One meaningful catalyst is the current insurance pricing backdrop. Commercial property and casualty pricing has remained firm in many lines, and higher interest rates compared with the pre-2022 era improve the income earned on newly invested fixed-income assets. Another catalyst is the company’s long dividend record, which reflects financial resilience and can support market confidence even when insurance results fluctuate.
Recent company updates have also highlighted continued premium growth and healthy investment income trends. For an insurer like Cincinnati Financial, that combination can create a favorable operating setup when underwriting discipline holds.
Risks
This article is for informational purposes only and does not constitute financial advice. Some content is AI-generated. See Disclaimer


