Stock Analysis · Chimera Investment Corporation (CIM-PD)
Overview
Chimera Investment Corporation is a mortgage real estate investment trust, or mortgage REIT. Unlike a traditional property REIT that owns buildings, Chimera mainly invests in mortgage-related assets and earns money from the spread between the income generated by those assets and the cost of the financing used to hold them. The preferred stock symbol CIM-PD represents one of the company’s preferred share classes, but the underlying business analysis depends on the same operating platform as Chimera overall.
The company focuses on residential mortgage credit. In practice, that means buying or securitizing pools of home-loan-related assets, managing financing, and collecting interest and other income tied to those investments. Chimera has also built its strategy around assets it believes can generate stronger returns than plain agency mortgage securities, especially through credit-sensitive residential loans and securitization structures.
Based on the company’s recent filings, Chimera’s economic exposure is centered on residential mortgage credit rather than a broad mix of real estate categories. Its revenue and earnings can move sharply from year to year because accounting results for mortgage REITs include market-value changes, gain-on-sale activity, and hedging effects. That makes the business less intuitive than a typical landlord model.
The main sources of revenue are best understood as a mix of interest income and investment-related gains tied to residential mortgage assets. Exact percentages can shift meaningfully from quarter to quarter, but the business is primarily driven by the following sources:
- Net interest income from mortgage assets: generally the largest recurring source. This comes from interest earned on residential mortgage loans, securitized mortgage assets, and related investments, minus the interest Chimera pays on its borrowings.
- Income from securitization and structured mortgage investments: a major contributor. This includes returns from non-agency residential mortgage-backed securities, investor loans, re-performing loans, and other residential credit positions held directly or through securitization vehicles.
- Realized and unrealized gains or losses on investments and hedges: a highly variable source. These items can materially lift or reduce reported earnings depending on interest rates, credit spreads, and asset prices.
- Other investment income and fees: a smaller component, including miscellaneous income associated with its portfolio and capital markets activity.
Recent operating patterns suggest that results improved after the deep disruption of 2022, with stronger revenue recovery in 2025 and continued emphasis on residential credit assets. The broad picture is a specialized income vehicle tied much more to mortgage market conditions than to physical property ownership.
The business has been unusually volatile over the last several years: earnings moved from strong profitability to a loss in 2022 and then back to positive territory. More recently, revenue and operating income recovered sharply, but interest expense remained very high, which is a central feature of the model.
Key Figures
| Metric | Value | Sector ⓘ |
|---|---|---|
| Date | Oct 17, 2026 | |
| Context | ||
| Sector | Real Estate | |
| Industry | REIT - Mortgage | |
| Market Cap ⓘ | $3.40B | |
| Beta ⓘ | 1.81 | |
Value (Cheapness) | ||
| P/E Ratio ⓘ | 28.98 | 17.38 |
| P/B Ratio ⓘ | 0.75 | 0.85 |
| FCF Yield ⓘ | -4.20% | 7.38% |
| Dividend Yield ⓘ | 7.30% | 4.85% |
| EBIT / EV ⓘ | 1.02% | 3.78% |
| PEG ⓘ | N/A | |
Growth (Business expansion) | ||
| Revenue Growth ⓘ | 8.10% | 5.30% |
| RPS Growth (5Y CAGR) ⓘ | -6.72% | 6.02% |
| EPS Growth (5Y CAGR) ⓘ | -24.88% | -11.37% |
| BVPS Growth (5Y CAGR) ⓘ | -9.48% | 0.45% |
| Margin Growth (5Y Trend) ⓘ | 32.16% | -0.22% |
| FCF Growth (5Y CAGR) ⓘ | N/A | 5.40% |
| DPS Growth (5Y CAGR) ⓘ | -14.02% | 5.02% |
Quality (Business durability) | ||
| ROIC (Latest) ⓘ | 1.05% | 5.69% |
| ROE (Latest) ⓘ | 0.05% | 7.56% |
| ROA (Latest) ⓘ | 0.01% | 2.85% |
| ROIC (5Y Median) ⓘ | 4.65% | 4.22% |
| ROE (5Y Median) ⓘ | 6.92% | 6.03% |
| ROA (5Y Median) ⓘ | 1.35% | 2.44% |
| Net Debt / EBIT (Latest) ⓘ | 86.51 | 7.59 |
| Net Debt / EBIT (5Y Median) ⓘ | 16.04 | 8.40 |
| Net Debt / EBITDA (Latest) ⓘ | 76.80 | 5.27 |
| Net Debt / Assets ⓘ | 81.06% | 37.76% |
| EBITDA / Interest ⓘ | 0.29 | 4.10 |
| Operating Margin (Latest) ⓘ | 22.23% | 35.29% |
| Operating Margin (5Y Median) ⓘ | 95.97% | 37.31% |
| Debt to Equity (Latest) ⓘ | 556.80% | 88.87% |
| Profit Margin (Latest) ⓘ | 0.55% | 19.61% |
| Free Cash Flow (Latest) ⓘ | -$142.83M | |
Momentum (Price trend) | ||
| 3Y Return ⓘ | +38.68% | +30.75% |
| 12M Return (excl. last month) ⓘ | +7.60% | +4.36% |
| 6M Return ⓘ | -6.06% | -2.52% |
| Price vs. 200-Day MA ⓘ | -5.03% | -2.34% |
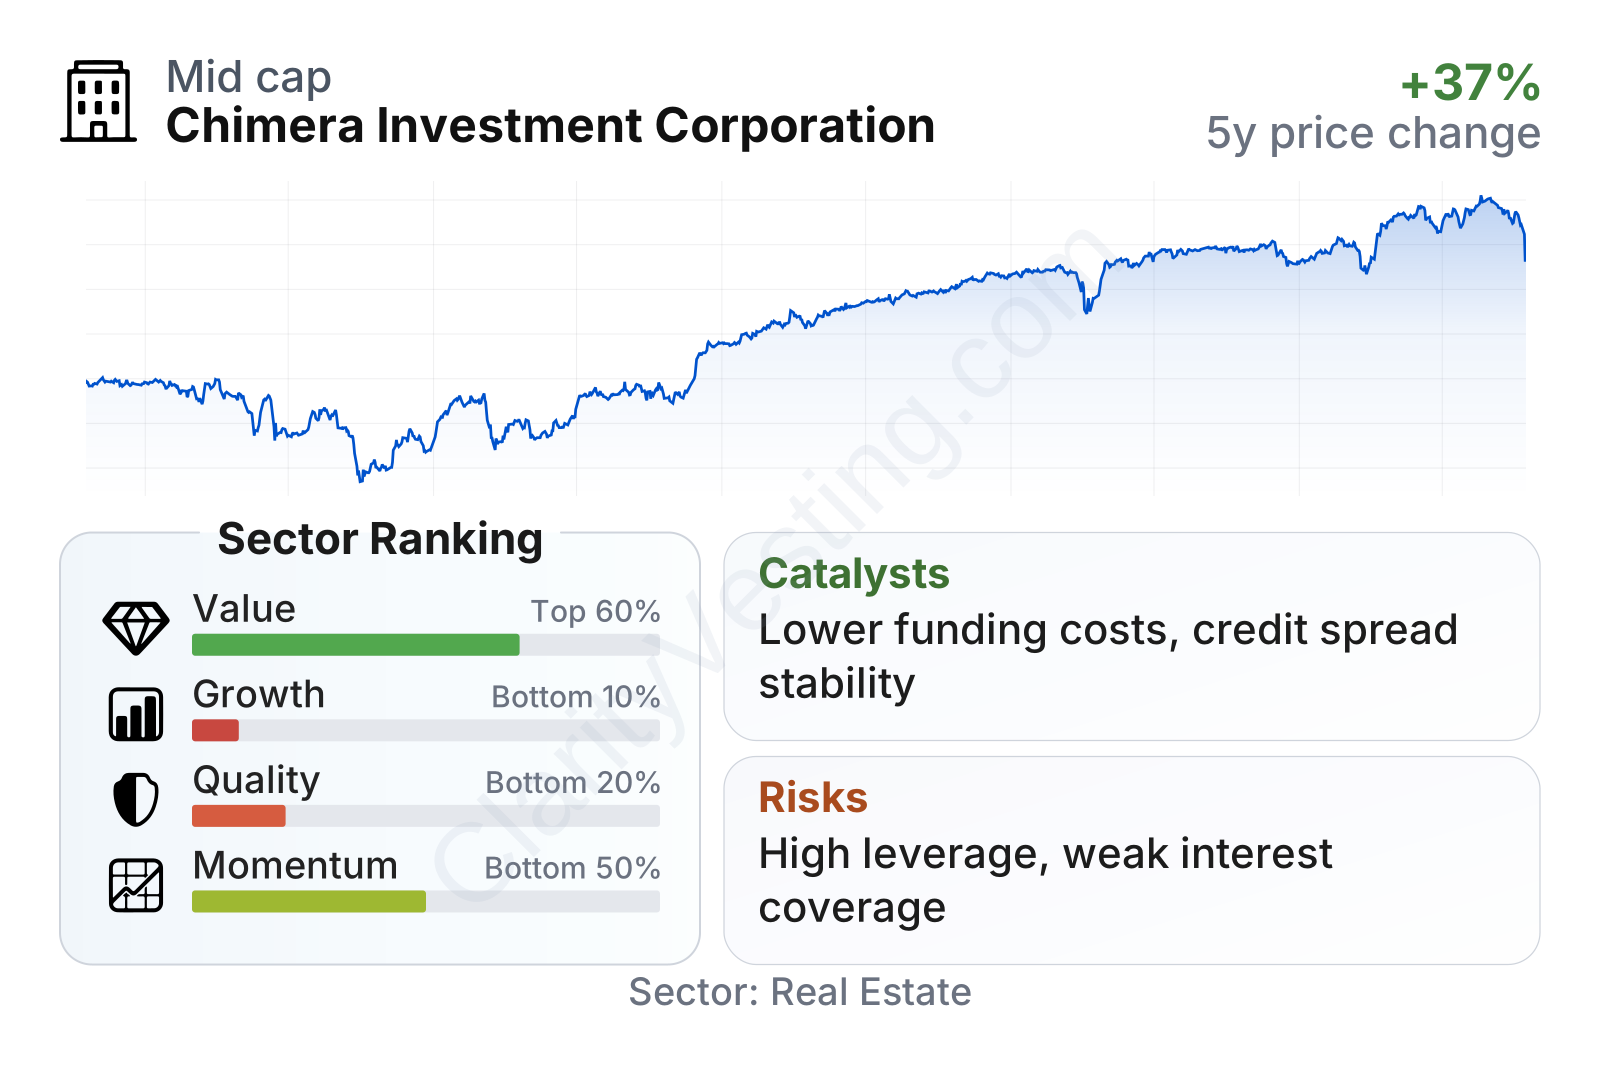
Chimera is a mid-sized mortgage REIT with a relatively high share-price sensitivity, reflected in a beta well above 1. On valuation, the shares trade below book value, which is common in the mortgage REIT space, and the dividend yield stands above the sector median. However, the quality and growth profiles are weak relative to peers. Profitability, returns on capital, and balance-sheet leverage all look strained, while recent share-price momentum has been somewhat better than the broader real estate group.
The stock price trend since late 2021 shows a steep decline in 2022 followed by a long recovery through 2024, 2025, and into 2026. That pattern fits a mortgage REIT that was hit hard by rate shocks and then gradually repriced as credit markets stabilized and earnings improved.
Growth
Chimera operates in a sector that can grow, but not in the straightforward way many businesses do. Mortgage REIT growth depends less on selling more products and more on capital allocation, funding costs, credit performance, and access to attractive mortgage assets. The residential mortgage credit market is large and persistent because U.S. housing finance constantly creates new assets to acquire, securitize, or finance. That gives Chimera a durable opportunity set, especially in segments where specialist underwriting matters more than pure scale.
The company’s strategy is sensible in one important respect: it focuses on residential credit assets that may offer better yields than plain agency mortgage securities. If financing markets are stable and credit losses remain contained, that approach can support earnings. It also gives Chimera some differentiation from agency-focused mortgage REITs whose economics are often even more exposed to pure interest-rate swings.
Revenue per share shows how uneven this business can be. After a severe drop in 2022, the trend turned positive in 2023 and 2024, then accelerated sharply in 2025. That rebound suggests the portfolio repositioning and market recovery helped restore earnings power, even if the longer five-year record still looks weak compared with the sector.
The dividend record tells a more cautious story. Distributions have trended lower over the past several years, even though the current yield remains high. For long-term analysis, this matters because mortgage REIT dividends often reflect the real earning power of the portfolio more clearly than headline yield alone.
A meaningful catalyst is the interest-rate environment. If short-term funding costs ease or stabilize while asset yields stay attractive, net interest spreads can improve. Another catalyst is continued normalization in residential credit markets, which can support both book value and recurring earnings. Chimera’s more recent recovery in operating performance points in that direction, although the business still depends heavily on external market conditions rather than internally generated growth.
Recent company communications have continued to emphasize portfolio management, financing discipline, and residential credit opportunities. In plain terms, the opportunity is not based on a breakthrough product or rapid expansion into a new market; it is based on earning better returns from mortgage assets as market conditions become less hostile.
Risks
This article is for informational purposes only and does not constitute financial advice. Some content is AI-generated. See Disclaimer


