Stock Analysis · Colliers International Group Inc Bats (CIGI)
Overview
Colliers International Group is a global real estate services company. Rather than owning large portfolios of buildings like a traditional property landlord, it mainly earns money by advising clients, managing properties and projects, arranging transactions, and providing investment management services. Its customers include property owners, occupiers, developers, financial institutions, and public-sector clients.
Its business is typically organized around three main engines:
- Real Estate Services – the largest contributor. This includes leasing, capital markets, property management, valuation and advisory, loan servicing, and other recurring service lines tied to commercial real estate activity.
- Engineering – a substantial and increasingly important contributor. Through subsidiaries such as Englobe, the company provides engineering, design, environmental, and related technical services that broaden Colliers beyond brokerage.
- Investment Management – the smallest of the three by revenue, but strategically important because it adds fee-based income tied to assets under management and deepens relationships with institutional clients.
Based on recent annual disclosures and the company’s current structure, Real Estate Services appears to represent roughly 65% to 75% of revenue, Engineering about 20% to 30%, and Investment Management about 5% to 10%. The exact mix can shift with acquisitions, market activity, and reporting changes, but the broad picture is clear: Colliers is primarily a services platform with a growing engineering arm and a smaller investment management business.
This matters for long-term analysis because service businesses can be more flexible than property owners during difficult real estate cycles. Even so, some of Colliers’ revenue still depends on transaction volumes, leasing demand, and confidence in commercial property markets. Recent operating trends show a business that has expanded revenue meaningfully since 2021, while also moving from a loss in 2021 to positive operating and net income in later years. Profitability improved sharply in 2022 and 2024, although net income remained somewhat uneven afterward, showing that growth has not translated into consistently smooth earnings.
The business mix has become larger over time, but the path has not been perfectly linear. Revenue reached a new high in 2025, while operating income stayed relatively solid, suggesting that scale is improving. At the same time, net profit remains more volatile than top-line growth, which is common in acquisitive professional services groups that carry amortization, integration costs, and cyclical exposure.
Key Figures
| Metric | Value | Sector ⓘ |
|---|---|---|
| Date | Oct 17, 2026 | |
| Context | ||
| Sector | Real Estate | |
| Industry | Real Estate Services | |
| Market Cap ⓘ | $4.40B | |
| Beta ⓘ | 1.25 | |
Value (Cheapness) | ||
| P/E Ratio ⓘ | 40.62 | 17.38 |
| P/B Ratio ⓘ | 14.45 | 0.85 |
| FCF Yield ⓘ | 4.54% | 7.38% |
| Dividend Yield ⓘ | 0.35% | 4.85% |
| EBIT / EV ⓘ | 5.12% | 3.78% |
| PEG ⓘ | 1.22 | |
Growth (Business expansion) | ||
| Revenue Growth ⓘ | 16.70% | 5.30% |
| RPS Growth (5Y CAGR) ⓘ | 12.40% | 6.02% |
| EPS Growth (5Y CAGR) ⓘ | -23.22% | -11.37% |
| BVPS Growth (5Y CAGR) ⓘ | -16.46% | 0.45% |
| Margin Growth (5Y Trend) ⓘ | 9.90% | -0.22% |
| FCF Growth (5Y CAGR) ⓘ | 0.14% | 5.40% |
| DPS Growth (5Y CAGR) ⓘ | 43.52% | 5.02% |
Quality (Business durability) | ||
| ROIC (Latest) ⓘ | 7.67% | 5.69% |
| ROE (Latest) ⓘ | 55.04% | 7.56% |
| ROA (Latest) ⓘ | 1.48% | 2.85% |
| ROIC (5Y Median) ⓘ | 9.35% | 4.22% |
| ROE (5Y Median) ⓘ | 8.63% | 6.03% |
| ROA (5Y Median) ⓘ | 1.24% | 2.44% |
| Net Debt / EBIT (Latest) ⓘ | 7.55 | 7.59 |
| Net Debt / EBIT (5Y Median) ⓘ | 5.95 | 8.40 |
| Net Debt / EBITDA (Latest) ⓘ | 4.49 | 5.27 |
| Net Debt / Assets ⓘ | 37.65% | 37.76% |
| EBITDA / Interest ⓘ | 7.03 | 4.10 |
| Operating Margin (Latest) ⓘ | 6.58% | 35.29% |
| Operating Margin (5Y Median) ⓘ | 7.08% | 37.31% |
| Debt to Equity (Latest) ⓘ | 214.41% | 88.87% |
| Profit Margin (Latest) ⓘ | 1.81% | 19.61% |
| Free Cash Flow (Latest) ⓘ | $199.60M | |
Momentum (Price trend) | ||
| 3Y Return ⓘ | -1.22% | +30.75% |
| 12M Return (excl. last month) ⓘ | -45.54% | +4.36% |
| 6M Return ⓘ | -20.25% | -2.52% |
| Price vs. 200-Day MA ⓘ | -15.36% | -2.34% |
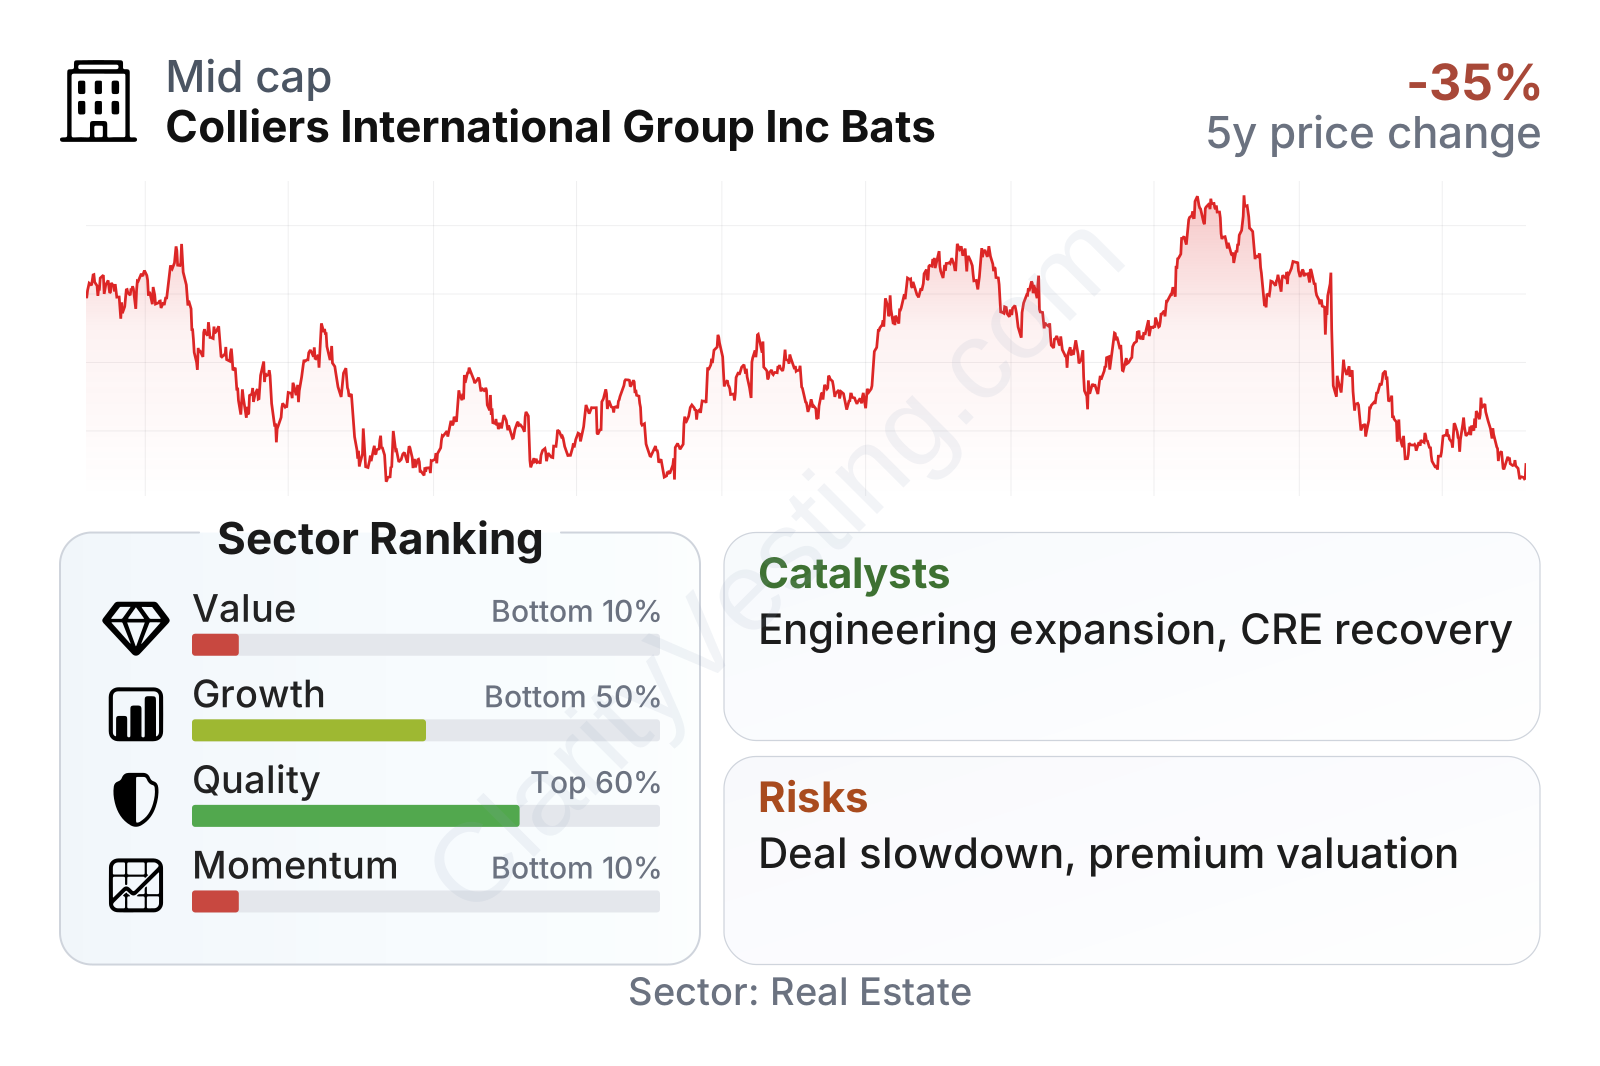
Colliers sits in an unusual position. Growth in revenue has been stronger than the sector median, and returns on invested capital are respectable, but the stock still screens as expensive on common valuation measures. Quality is mixed: interest coverage and leverage versus EBITDA look acceptable for the industry, yet profit margin and return on assets remain modest. Price performance has also been weak relative to the broader real estate sector, which suggests the market has become more cautious about the company’s earnings consistency and valuation premium.
The share price history shows a cyclical and volatile pattern rather than a steady climb. After strong periods in 2024 and late 2025, the stock pulled back sharply into 2026. With a beta above 1, the shares have also tended to move more than the market, which fits a company exposed to both commercial real estate activity and acquisition-driven expectations.
Growth
Colliers operates in parts of the economy that should remain relevant for many years: commercial real estate services, infrastructure-linked engineering, and institutional investment management. The real estate industry itself is cyclical, but the long-term need for outsourcing, project management, valuation, technical consulting, and specialized advice has been growing. Large clients increasingly prefer global service providers with broad capabilities, and that favors scaled platforms such as Colliers.
A major part of the company’s strategy is to reduce reliance on pure transaction brokerage by building recurring revenue streams. Property management, outsourcing, engineering, and investment management are all helpful in that respect. This is strategically sensible because these activities can hold up better when property sales volumes slow. It also gives Colliers more cross-selling opportunities across the life cycle of a real estate asset, from design and due diligence to leasing, operations, and capital raising.
Revenue per share has trended upward over the past five years and accelerated strongly in the latest annual period. That points to genuine business expansion rather than simple financial engineering. However, the uneven path before the latest jump also shows that growth still depends partly on market conditions and deal activity.
Acquisitions remain an important catalyst. Colliers has historically expanded by buying specialist firms and then using its global platform to broaden distribution and services. When integration is successful, this can strengthen local expertise while increasing recurring revenue. The engineering platform is especially notable because it adds end markets outside classic commercial brokerage and can support a broader infrastructure and environmental consulting presence.
The dividend has grown quickly from a low base, but the yield remains very small, under 1%. In practical terms, the dividend is not the main reason the company attracts attention. It is better viewed as a sign that management wants to return some capital while still prioritizing reinvestment, acquisitions, and balance sheet flexibility.
Recent company updates have continued to emphasize expansion in outsourcing, engineering, and investment management. Those areas are important because they can make Colliers less dependent on office leasing and large property transactions, two categories that have been under pressure across parts of commercial real estate. If interest rates stabilize and transaction markets recover, Colliers could benefit both from cyclical normalization and from the larger platform it has built in the meantime.
Risks
This article is for informational purposes only and does not constitute financial advice. Some content is AI-generated. See Disclaimer


