Stock Analysis · Cigna Corp (CI)
Overview
Cigna is a large healthcare company built around insurance, pharmacy benefit management, and related health services. The business operates under The Cigna Group name, but the stock still trades under the long-established ticker CI. In simple terms, the company helps employers, governments, and individuals pay for medical care and prescription drugs, while also offering care management, pharmacy services, and international health coverage.
The company’s revenue base is heavily shaped by its health services operations, especially pharmacy benefits, with its insurance activities providing a smaller but still important contribution. Based on recent annual reporting, the main sources of revenue can be summarized as follows:
- Evernorth Health Services: about 75% to 80% of total revenue. This includes pharmacy benefit management, specialty pharmacy, home delivery pharmacy, care services, and other tools used by employers, health plans, and government clients to manage drug spending and patient care.
- Cigna Healthcare: about 20% to 25% of total revenue. This segment includes U.S. commercial medical insurance, international health benefits, and U.S. government-related health activities that remained with the company after the Medicare business exit.
- Corporate and other activities: a very small share of revenue. This mainly reflects items outside the two core operating segments rather than a major business line.
This structure matters because Cigna is not just a traditional health insurer. A large share of its business depends on managing prescription drug benefits and healthcare services at scale, which gives it a different earnings profile from pure insurance peers.
Over the last several years, total revenue has expanded sharply, while operating income has grown more slowly. That suggests the company is getting bigger, but growth is coming from activities where margins are naturally thinner, especially large pharmacy-related flows.
The business mix shows a company that has become much larger in revenue terms, but where profitability depends on disciplined cost control rather than wide margins. Revenue has risen strongly since 2021, while net income has been more uneven, reflecting the low-margin nature of healthcare administration and pharmacy benefit operations.
Key Figures
| Metric | Value | Sector ⓘ |
|---|---|---|
| Date | Oct 17, 2026 | |
| Context | ||
| Sector | Healthcare | |
| Industry | Healthcare Plans | |
| Market Cap ⓘ | $76.52B | |
| Beta ⓘ | 0.30 | |
Value (Cheapness) | ||
| P/E Ratio ⓘ | 11.68 | 24.79 |
| P/B Ratio ⓘ | 1.86 | 3.08 |
| FCF Yield ⓘ | 11.91% | 3.15% |
| Dividend Yield ⓘ | 2.17% | 1.94% |
| EBIT / EV ⓘ | 10.30% | 0.57% |
| PEG ⓘ | 0.75 | |
Growth (Business expansion) | ||
| Revenue Growth ⓘ | 6.70% | 7.45% |
| RPS Growth (5Y CAGR) ⓘ | 19.29% | 8.61% |
| EPS Growth (5Y CAGR) ⓘ | -10.12% | -17.81% |
| BVPS Growth (5Y CAGR) ⓘ | 3.13% | 3.72% |
| Margin Growth (5Y Trend) ⓘ | -1.43% | -0.62% |
| FCF Growth (5Y CAGR) ⓘ | 8.57% | 1.04% |
| DPS Growth (5Y CAGR) ⓘ | 11.40% | 6.77% |
Quality (Business durability) | ||
| ROIC (Latest) ⓘ | 10.90% | 3.24% |
| ROA (Latest) ⓘ | 4.07% | 3.01% |
| ROIC (5Y Median) ⓘ | 9.26% | 4.60% |
| ROA (5Y Median) ⓘ | 3.48% | 1.89% |
| Net Debt / EBIT (Latest) ⓘ | 2.60 | 1.34 |
| Net Debt / EBIT (5Y Median) ⓘ | 2.65 | 1.84 |
| Net Debt / EBITDA (Latest) ⓘ | 2.04 | 1.00 |
| Net Debt / Assets ⓘ | 16.28% | 5.45% |
| EBITDA / Interest ⓘ | 9.01 | 9.64 |
| Operating Margin (Latest) ⓘ | 3.49% | 9.27% |
| Operating Margin (5Y Median) ⓘ | 4.63% | 7.38% |
| Debt to Equity (Latest) ⓘ | 74.80% | 28.58% |
| Profit Margin (Latest) ⓘ | 2.27% | 3.59% |
| Free Cash Flow (Latest) ⓘ | $9.11B | |
Momentum (Price trend) | ||
| 3Y Return ⓘ | +1.48% | +42.80% |
| 12M Return (excl. last month) ⓘ | -0.56% | +18.50% |
| 6M Return ⓘ | +12.52% | +7.57% |
| Price vs. 200-Day MA ⓘ | +7.58% | +5.12% |
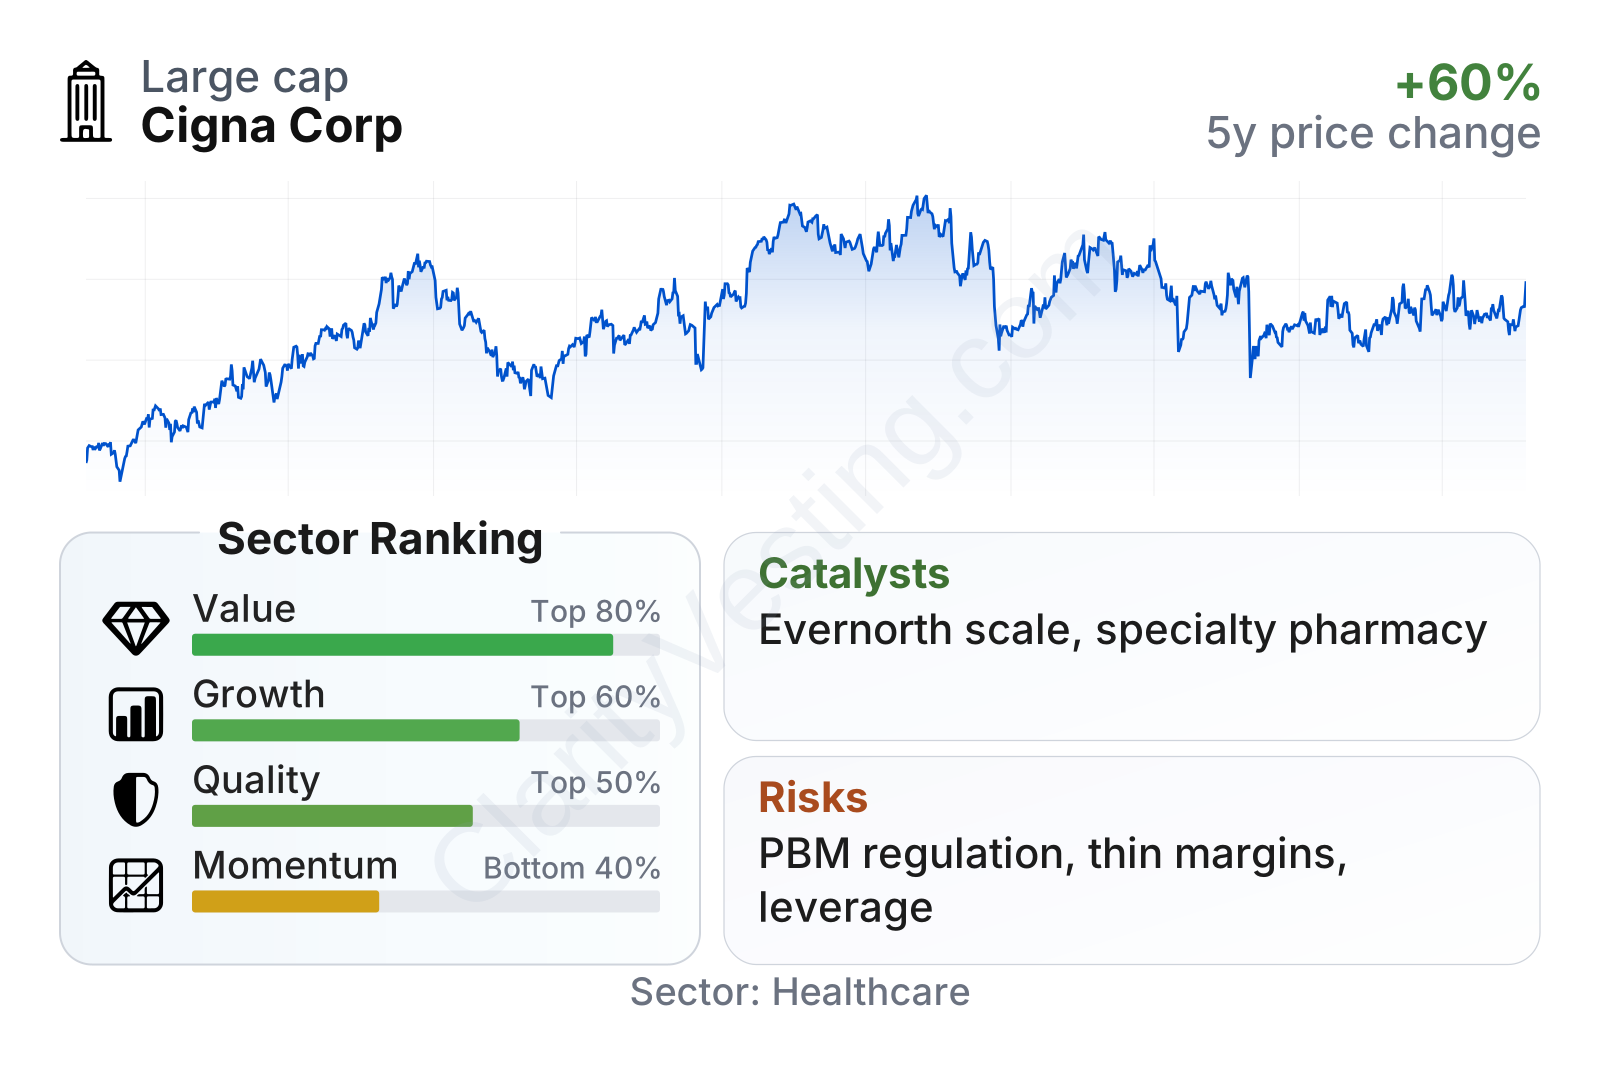
Cigna is a very large healthcare company with a market value in the tens of billions of dollars and a notably low beta, meaning its stock has historically moved less than the broader market. On valuation, several measures look cheaper than the healthcare sector median, especially earnings, book value, and free cash flow yield. Growth is more mixed: recent revenue growth is positive but not exceptional versus the sector, while longer-term revenue per share and free cash flow growth have been stronger. Quality is less impressive overall because leverage is higher than many healthcare peers and margins are relatively thin. Momentum is the weakest area, with the share price lagging much of the sector over several time frames.
Growth
Cigna operates in a sector with durable long-term demand. Healthcare spending tends to rise over time because of aging populations, higher use of chronic-disease treatment, increasing prescription drug complexity, and the continued need for employers and public programs to manage costs. That creates room for companies that can combine insurance, drug benefit management, and care coordination in a single platform.
The company’s strategy broadly fits that environment. Evernorth gives Cigna exposure to prescription volume, specialty drugs, and care management services, which are areas likely to remain important as drug costs keep rising. Cigna Healthcare adds employer-sponsored insurance and international coverage, both of which can support recurring revenue and cross-selling opportunities. This combination gives the group multiple ways to grow without relying on just one market.
Revenue growth has been positive in recent periods, though it has cooled from the unusually strong pace seen in 2024. That slowdown does not automatically signal a broken business; it is more consistent with a company lapping a period of faster expansion and returning to a more normalized growth range in the mid-single digits.
Cash generation remains one of the more encouraging parts of the profile. Free cash flow has moved around from year to year, but it has stayed substantial in absolute dollars. For a company in healthcare services, that matters because strong cash generation can support debt reduction, dividends, share repurchases, and internal investment even when accounting profit margins are modest.
A notable recent development is Cigna’s continued reshaping of its portfolio after the sale of its Medicare businesses, which simplified the company and increased focus on commercial healthcare and Evernorth. The company has also emphasized specialty pharmacy, biosimilars, and cost-management programs for employers and health plans. These are practical growth drivers because clients are under pressure to control drug spending, especially in high-cost categories.
An additional catalyst comes from scale. Pharmacy benefit managers and integrated health services platforms can become more valuable as they handle more prescriptions, negotiate better terms, and spread technology and administrative costs across a broader client base. If Cigna continues to expand client relationships while retaining discipline on expenses, the current structure supports further earnings and cash flow growth even without dramatic margin expansion.
Risks
This article is for informational purposes only and does not constitute financial advice. Some content is AI-generated. See Disclaimer


