Stock Analysis · Chord Energy Corp (CHRD)
Overview
Chord Energy Corp is an independent oil and gas producer focused on the Williston Basin, especially the Bakken and Three Forks formations in North Dakota and Montana. In simple terms, the company drills wells, produces crude oil, natural gas, and natural gas liquids, then sells those products into the market. Its business is centered on upstream energy production rather than refining, chemicals, or fuel retailing.
Revenue mainly comes from selling the hydrocarbons it produces. Based on the company’s business mix described in its recent filings, crude oil is the dominant source, with natural gas liquids and natural gas making up the smaller remainder. Exact percentages can move with both production mix and commodity prices, but a reasonable approximation is:
- Crude oil: about 70% to 80% of revenue. This is the company’s main earnings engine and the most important driver of profitability.
- Natural gas liquids: about 10% to 20% of revenue. This includes products such as propane and butane extracted during processing.
- Natural gas: about 5% to 15% of revenue. This is the smallest product stream and tends to be less valuable per unit than oil.
Chord’s business model is straightforward: acquire or develop acreage, drill and complete wells, keep production relatively efficient, and return part of cash generation to shareholders while maintaining a conservative balance sheet. The company became much larger after combining Oasis Petroleum and Whiting Petroleum, and it has continued to use scale in the Bakken as a central part of its strategy.
The multi-year financial flow also shows an important pattern: revenue expanded sharply from 2021 through 2024, but profitability narrowed meaningfully in 2025 as costs rose and earnings compressed. That is typical for a commodity producer: sales can stay large while margins swing widely with oil and gas prices, operating costs, and hedging outcomes.
Key Figures
| Metric | Value | Sector ⓘ |
|---|---|---|
| Date | Oct 03, 2026 | |
| Context | ||
| Sector | Energy | |
| Industry | Oil & Gas E&P | |
| Market Cap ⓘ | $7.35B | |
| Beta ⓘ | 0.39 | |
Value (Cheapness) | ||
| P/E Ratio ⓘ | 9.16 | 14.47 |
| P/B Ratio ⓘ | 0.91 | 1.70 |
| FCF Yield ⓘ | 16.17% | 8.66% |
| Dividend Yield ⓘ | 3.85% | 3.77% |
| EBIT / EV ⓘ | 11.04% | 7.46% |
| PEG ⓘ | N/A | |
Growth (Business expansion) | ||
| Revenue Growth ⓘ | 84.10% | 27.35% |
| RPS Growth (5Y CAGR) ⓘ | 2.45% | 6.75% |
| EPS Growth (5Y CAGR) ⓘ | -22.14% | -15.45% |
| BVPS Growth (5Y CAGR) ⓘ | 29.26% | 5.85% |
| Margin Growth (5Y Trend) ⓘ | -7.21% | 0.75% |
| FCF Growth (5Y CAGR) ⓘ | -0.20% | 3.62% |
| DPS Growth (5Y CAGR) ⓘ | 0.34% | 16.85% |
Quality (Business durability) | ||
| ROIC (Latest) ⓘ | 7.93% | 11.33% |
| ROA (Latest) ⓘ | 6.33% | 6.03% |
| ROIC (5Y Median) ⓘ | 15.85% | 10.16% |
| ROA (5Y Median) ⓘ | 12.33% | 5.34% |
| Net Debt / EBIT (Latest) ⓘ | 0.94 | 1.62 |
| Net Debt / EBIT (5Y Median) ⓘ | 0.86 | 1.91 |
| Net Debt / EBITDA (Latest) ⓘ | 0.36 | 1.06 |
| Net Debt / Assets ⓘ | 6.50% | 17.29% |
| EBITDA / Interest ⓘ | 25.11 | 9.64 |
| Operating Margin (Latest) ⓘ | 14.94% | 16.32% |
| Operating Margin (5Y Median) ⓘ | 22.26% | 19.53% |
| Debt to Equity (Latest) ⓘ | 17.98% | 54.41% |
| Profit Margin (Latest) ⓘ | 14.24% | 8.79% |
| Free Cash Flow (Latest) ⓘ | $1.19B | |
Momentum (Price trend) | ||
| 3Y Return ⓘ | -2.76% | +62.93% |
| 12M Return (excl. last month) ⓘ | +39.65% | +44.83% |
| 6M Return ⓘ | -4.03% | -1.62% |
| Price vs. 200-Day MA ⓘ | +8.66% | +5.18% |
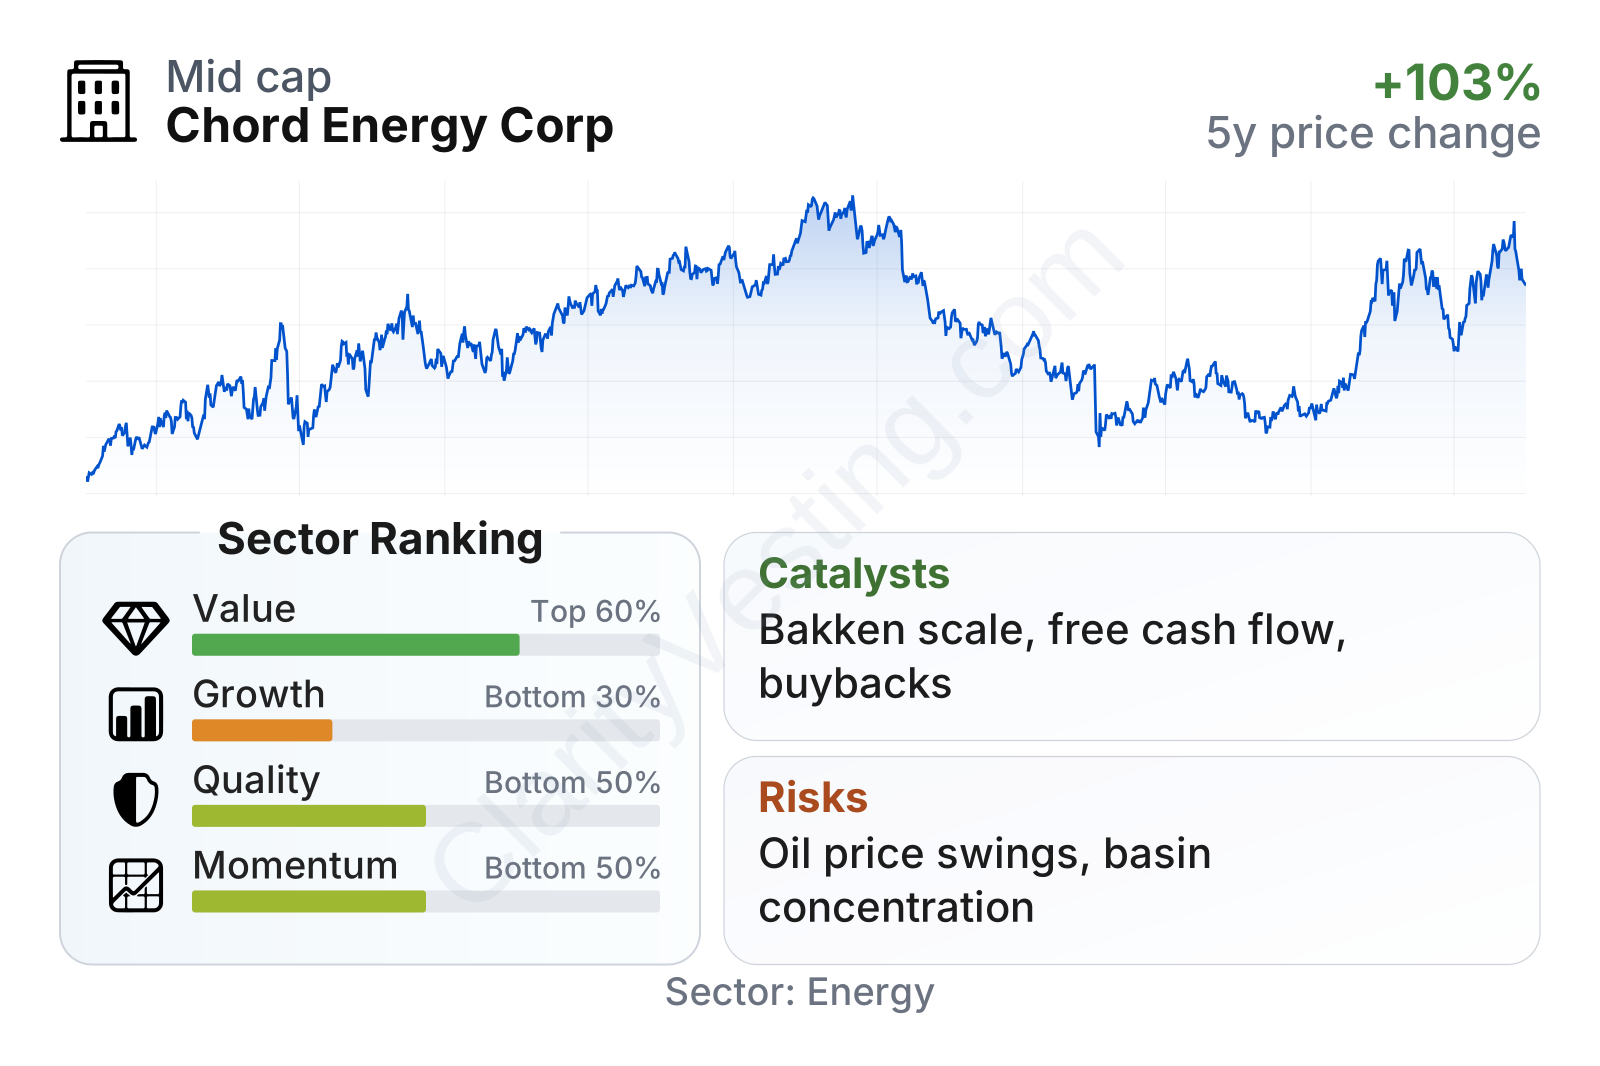
Chord is a mid-sized energy producer with a market value around the upper single-digit billions and an unusually low beta for an exploration and production company. On valuation, it screens cheaper than the sector on earnings and book value, while its cash generation relative to market value and enterprise value stands above the sector median. The mixed part is growth and operating quality: recent growth looks strong on a short-term basis, but the longer-term trend is weaker, which explains why the overall profile is not as clean as the low multiples alone might suggest.
The share price history also reflects how cyclical the business is. After a strong rise into 2024, the stock pulled back sharply, then partially recovered in 2026. That kind of movement is common in upstream energy because the market quickly reprices expected cash flow when oil prices, well productivity, or capital allocation assumptions change.
Growth
Chord operates in a sector that is mature rather than structurally high-growth, but that does not mean there are no growth opportunities. In shale oil and gas, growth usually comes from disciplined drilling inventory, operational efficiency, bolt-on acquisitions, and the ability to produce strong free cash flow without overextending the balance sheet. That framework fits Chord reasonably well.
The company’s strategic logic is centered on concentration in one core basin. That can be attractive when the acreage is good because it simplifies infrastructure, field operations, procurement, and technical execution. Chord has scale in the Bakken, which gives it a clearer operating focus than many smaller explorers. It also gives management room to high-grade drilling plans and manage activity levels depending on commodity prices.
Recent revenue growth has been volatile but improved noticeably again in 2026 after a weaker 2025. That rebound matters because it suggests the earnings trough may have been driven more by cyclical conditions than by a broken asset base. Still, the longer five-year growth picture remains less impressive than the short-term bounce, which means the company still has to prove that growth can be both durable and profitable.
Free cash flow is one of the most important measures for a company like Chord because it shows what is left after funding operations and capital spending. Even with fluctuations, the business has produced substantial free cash flow over time, including roughly $1.2 billion on a trailing basis. That supports dividends, share repurchases, debt management, and selective acquisitions. In long-term analysis, this is one of Chord’s strongest features.
A meaningful catalyst is the company’s ability to keep consolidating and optimizing Bakken assets. The sector remains fragmented enough that well-positioned operators can create value by combining acreage, reducing overlapping costs, and improving drilling schedules. Another potential tailwind is any sustained improvement in oil prices, since Chord’s revenue mix is heavily weighted toward crude oil and its earnings power is highly sensitive to that market.
Recent company communications have also emphasized shareholder returns and efficiency gains, which is important in today’s U.S. shale market. The industry has moved away from “growth at any cost” toward returns, inventory quality, and capital discipline. Chord’s current approach appears aligned with that shift.
Risks
This article is for informational purposes only and does not constitute financial advice. Some content is AI-generated. See Disclaimer