Stock Analysis · CK Asset Holdings Limited (CHKGF)
Overview
CK Asset Holdings Limited is a Hong Kong-based property group with operations that extend beyond traditional real estate development. The company develops and sells residential and mixed-use projects, owns investment properties that generate rental income, runs infrastructure and utility-related investments through associated holdings, and has exposure to pub operations in the United Kingdom. This mix makes CK Asset broader than a pure homebuilder, although property remains the economic center of the business.
Its revenue base can shift meaningfully from year to year because property development income depends on when projects are completed and handed over. Based on the company’s latest annual reporting structure, the main sources of revenue are approximately:
- Property sales and development: about 60% to 70% — sale of residential, commercial, and mixed-use developments, mainly in Hong Kong, Mainland China, and selected overseas markets.
- Property leasing and related services: about 10% to 15% — recurring rental income from offices, retail assets, industrial properties, hotels, and serviced suites.
- Hotels and serviced suites / asset operations: about 5% to 10% — hospitality-related income and management of accommodation assets.
- Pub operations and other businesses: about 10% to 20% — mainly contribution from Greene King and other non-core operating segments.
- Share of results from infrastructure, utilities, and other investments: meaningful to profit but not always fully reflected in revenue — this includes associated investments that can materially support earnings and cash generation.
That structure matters for long-term analysis. A company with large development exposure can look weak in one period and strong in another depending on project timing, while recurring rent, infrastructure income, and operating businesses can soften that cyclicality.
The broad financial flow over recent years shows a business with sizable gross profit generation, but also with earnings pressure as revenue and net income declined after 2021 before a rebound in reported revenue later on. The decline in net income despite still-large turnover underlines that CK Asset is not just about sales volume; margins, property market conditions, and financing costs matter a lot.
The operating picture points to a company that still produces substantial profit and cash, but with more variability than the headline size of the group might suggest.
Key Figures
| Metric | Value | Sector ⓘ |
|---|---|---|
| Date | Oct 24, 2026 | |
| Context | ||
| Sector | Real Estate | |
| Industry | Real Estate - Development | |
| Market Cap ⓘ | $20.78B | |
| Beta ⓘ | 0.54 | |
Value (Cheapness) | ||
| P/E Ratio ⓘ | 12.37 | 17.85 |
| P/B Ratio ⓘ | 0.05 | 0.87 |
| FCF Yield ⓘ | 196.92% | 7.30% |
| Dividend Yield ⓘ | 30.32% | 4.83% |
| EBIT / EV ⓘ | N/A | 3.78% |
| PEG ⓘ | 0.79 | |
Growth (Business expansion) | ||
| Revenue Growth ⓘ | 58.80% | 5.35% |
| RPS Growth (5Y CAGR) ⓘ | 0.31% | 6.02% |
| EPS Growth (5Y CAGR) ⓘ | -47.93% | -10.65% |
| BVPS Growth (5Y CAGR) ⓘ | 2.10% | 0.43% |
| Margin Growth (5Y Trend) ⓘ | -11.00% | -0.69% |
| FCF Growth (5Y CAGR) ⓘ | -7.54% | 5.40% |
| DPS Growth (5Y CAGR) ⓘ | -1.82% | 5.07% |
Quality (Business durability) | ||
| ROIC (Latest) ⓘ | 6.33% | 5.69% |
| ROE (Latest) ⓘ | 6.29% | 7.37% |
| ROA (Latest) ⓘ | 5.00% | 2.85% |
| ROIC (5Y Median) ⓘ | 3.48% | 4.26% |
| ROE (5Y Median) ⓘ | 4.63% | 6.04% |
| ROA (5Y Median) ⓘ | 3.44% | 2.45% |
| Net Debt / EBIT (Latest) ⓘ | -0.49 | 7.55 |
| Net Debt / EBIT (5Y Median) ⓘ | 1.28 | 8.26 |
| Net Debt / EBITDA (Latest) ⓘ | -0.43 | 5.26 |
| Net Debt / Assets ⓘ | -3.28% | 37.45% |
| EBITDA / Interest ⓘ | N/A | 4.11 |
| Operating Margin (Latest) ⓘ | 27.14% | 33.86% |
| Operating Margin (5Y Median) ⓘ | 37.04% | 37.49% |
| Debt to Equity (Latest) ⓘ | 11.89% | 88.76% |
| Profit Margin (Latest) ⓘ | 18.55% | 18.94% |
| Free Cash Flow (Latest) ⓘ | $40.92B | |
Momentum (Price trend) | ||
| 3Y Return ⓘ | +37.67% | +36.33% |
| 12M Return (excl. last month) ⓘ | +29.66% | +4.32% |
| 6M Return ⓘ | +0.85% | -1.74% |
| Price vs. 200-Day MA ⓘ | +32.11% | -1.42% |
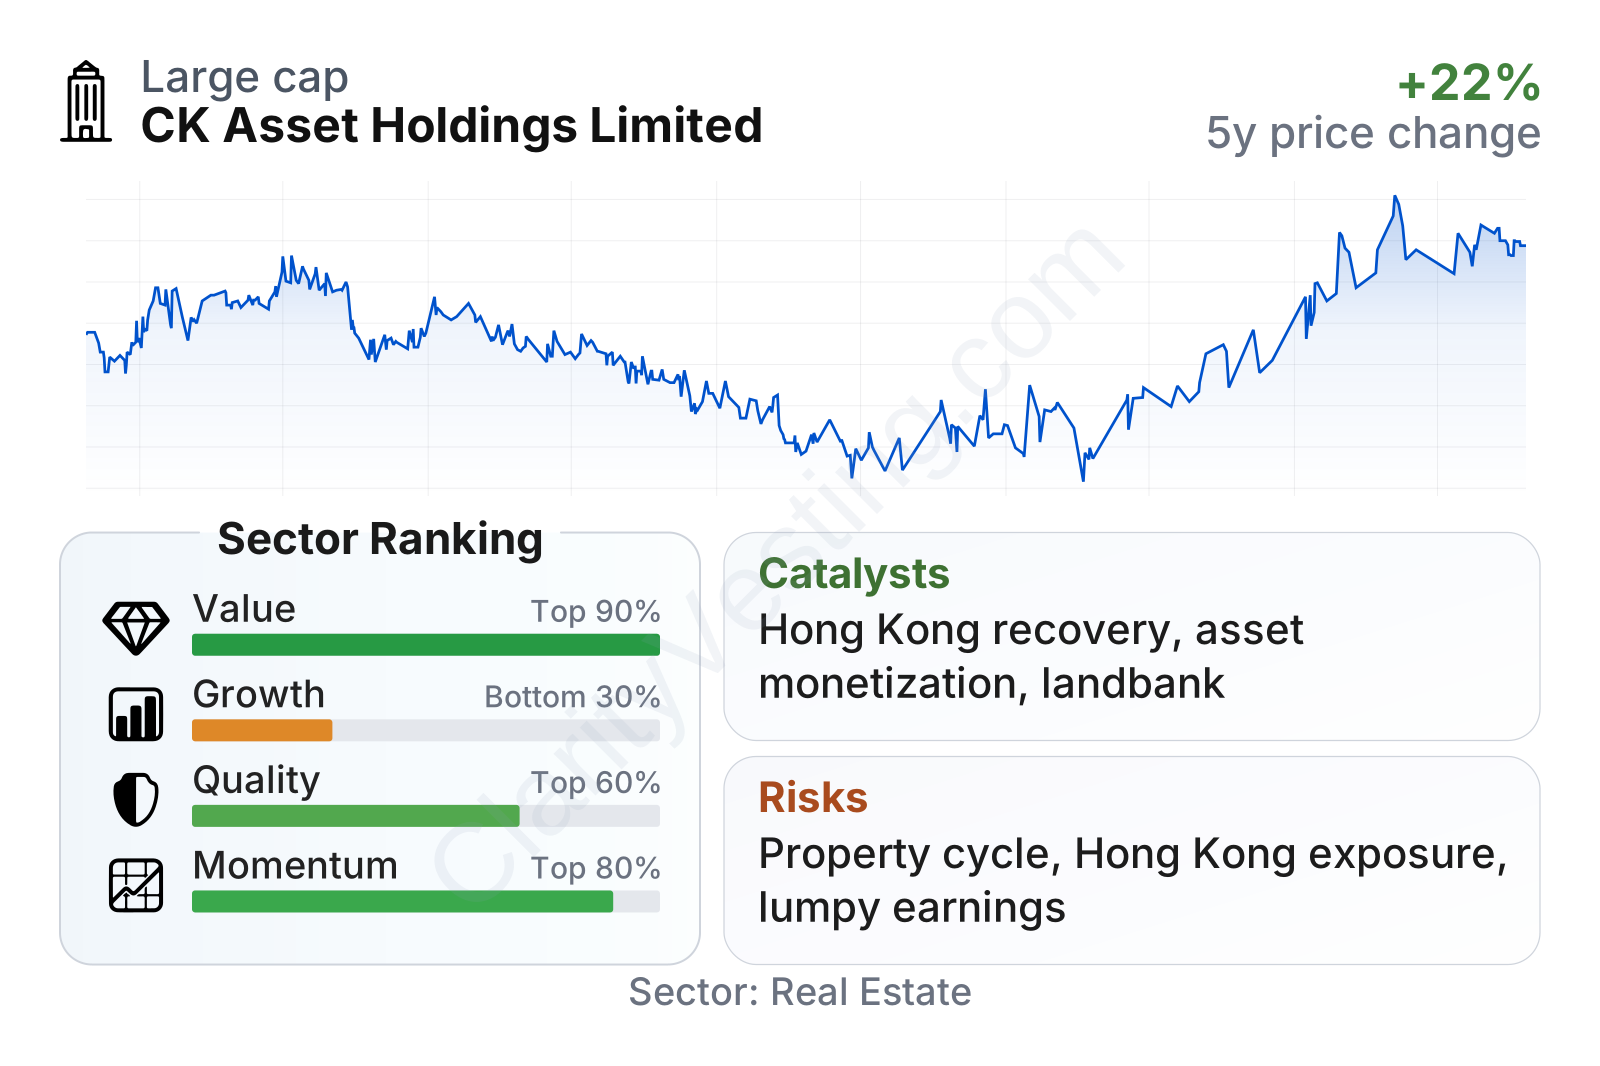
CK Asset stands out on valuation, balance sheet strength, and recent share-price momentum. The company screens cheaply relative to much of the real estate sector, with a low earnings multiple and an exceptionally low price-to-book ratio. Dividend yield is also far above the sector median. On quality, the business is not at the very top of the sector, but asset returns are better than many peers and leverage is unusually conservative for real estate, with net cash on some measures and debt-to-equity around 12%.
The weak point is growth consistency. Recent year-over-year revenue growth looks strong, but the longer view is less impressive: five-year revenue per share growth is near flat, earnings per share have contracted sharply over that period, and free cash flow and dividends have been uneven. In short, CK Asset currently looks stronger on financial resilience and valuation than on sustained growth.
Growth
CK Asset operates in sectors that are mixed rather than uniformly high-growth. Real estate development in Hong Kong and Mainland China is mature and cyclical, not a structural growth engine in the way cloud software or semiconductors might be. However, large well-capitalized property groups can still create value over long periods by buying land and assets at attractive prices, recycling capital, and using downturns to strengthen their positions. That is especially relevant for CK Asset because its balance sheet is much stronger than many developers.
The company’s strategy makes the most sense as a capital allocator rather than as a straightforward volume grower. It has historically used its financial flexibility to move across geographies and asset types, combining development projects with recurring-income assets and non-property operations. That approach can work well when real estate markets are unsettled, because weaker competitors may be forced to sell assets or reduce bidding for new projects.
Revenue per share illustrates this uneven growth profile clearly. The business went through several years of decline before a rebound in the latest period. That pattern is typical of a developer with lumpy project completions, but it also shows why the market may hesitate to assign a richer valuation: the company has not yet established a smooth upward growth path.
The dividend record also reflects this. Payouts increased through 2023, then moved lower in 2024 and 2025. Even so, the yield remains high because the share price is low relative to the company’s underlying asset base. For a long-term view, the key issue is not only the current yield, but whether cash generation from development, rentals, and operating businesses can support a steadier dividend trajectory over time.
A practical catalyst is the company’s ability to deploy capital while many property markets remain under pressure. If management can acquire land, projects, or income-producing assets at attractive prices during a weak cycle, future returns could improve. Another catalyst is stabilization in Hong Kong and Mainland China property sentiment, which could help unlock value from CK Asset’s inventory and development pipeline. Because the group also owns recurring-income assets and non-property businesses, it has more than one path to improved results.
Recent corporate updates have also emphasized landbank management, project launches, and continuing asset monetization. None of these by itself changes the investment case overnight, but together they support the idea that CK Asset is positioned to benefit more from a recovery than a highly leveraged competitor would.
Risks
This article is for informational purposes only and does not constitute financial advice. Some content is AI-generated. See Disclaimer


