Stock Analysis · Chemed Corp (CHE)
Overview
Chemed Corp is a healthcare-focused holding company with two very different businesses. The larger one is VITAS Healthcare, a provider of hospice and palliative care services for patients with serious and terminal illnesses. The smaller one is Roto-Rooter, a plumbing and drain-cleaning services business that serves both residential and commercial customers across the United States. This mix gives Chemed exposure to healthcare demand that is tied to demographics and to a home-services business that tends to benefit from recurring repair needs rather than discretionary spending.
Revenue is mainly generated through the following sources:
- VITAS Healthcare: about 75% to 80% of total revenue. This business is paid primarily through Medicare, with additional revenue from Medicaid, commercial insurance, and private-pay sources. It includes routine home hospice, inpatient hospice, continuous care, and related end-of-life support services.
- Roto-Rooter: about 20% to 25% of total revenue. This includes plumbing repair, drain cleaning, water restoration, excavation, and related services delivered through company-owned branches and independent contractors.
Chemed’s business mix is unusual but understandable: one segment serves an aging population with medically necessary care, while the other benefits from everyday property maintenance and emergency service demand. In recent years, revenue has moved upward overall, but profitability has been more mixed, with 2025 showing pressure compared with 2024 as costs rose faster than gross profit.
The longer-term picture shows a company that has expanded sales steadily from a little above $2.1 billion in 2021 to roughly $2.5 billion in 2025, while net income remained solidly positive throughout the period. That consistency matters because it suggests the business model has remained resilient even when margins have fluctuated.
Key Figures
| Metric | Value | Sector ⓘ |
|---|---|---|
| Date | Oct 24, 2026 | |
| Context | ||
| Sector | Healthcare | |
| Industry | Medical Care Facilities | |
| Market Cap ⓘ | $6.68B | |
| Beta ⓘ | 0.51 | |
Value (Cheapness) | ||
| P/E Ratio ⓘ | 25.72 | 25.42 |
| P/B Ratio ⓘ | 8.41 | 3.08 |
| FCF Yield ⓘ | 4.84% | 3.12% |
| Dividend Yield ⓘ | 0.47% | 1.85% |
| EBIT / EV ⓘ | 5.40% | 0.56% |
| PEG ⓘ | 1.82 | |
Growth (Business expansion) | ||
| Revenue Growth ⓘ | 8.80% | 7.50% |
| RPS Growth (5Y CAGR) ⓘ | 6.97% | 8.60% |
| EPS Growth (5Y CAGR) ⓘ | -14.12% | -17.73% |
| BVPS Growth (5Y CAGR) ⓘ | 14.84% | 3.72% |
| Margin Growth (5Y Trend) ⓘ | -2.33% | -0.57% |
| FCF Growth (5Y CAGR) ⓘ | 6.83% | 0.96% |
| DPS Growth (5Y CAGR) ⓘ | 12.36% | 6.69% |
Quality (Business durability) | ||
| ROIC (Latest) ⓘ | N/A | 3.17% |
| ROA (Latest) ⓘ | 17.17% | 2.98% |
| ROIC (5Y Median) ⓘ | 27.22% | 4.56% |
| ROA (5Y Median) ⓘ | 17.93% | 1.87% |
| Net Debt / EBIT (Latest) ⓘ | 0.79 | 1.34 |
| Net Debt / EBIT (5Y Median) ⓘ | 0.22 | 1.86 |
| Net Debt / EBITDA (Latest) ⓘ | 0.67 | 1.00 |
| Net Debt / Assets ⓘ | 18.29% | 5.06% |
| EBITDA / Interest ⓘ | 89.51 | 9.55 |
| Operating Margin (Latest) ⓘ | 14.08% | 9.25% |
| Operating Margin (5Y Median) ⓘ | 15.66% | 7.33% |
| Debt to Equity (Latest) ⓘ | 39.63% | 26.68% |
| Profit Margin (Latest) ⓘ | 10.60% | 3.34% |
| Free Cash Flow (Latest) ⓘ | $323.61M | |
Momentum (Price trend) | ||
| 3Y Return ⓘ | +3.00% | +51.61% |
| 12M Return (excl. last month) ⓘ | +9.51% | +19.90% |
| 6M Return ⓘ | +39.77% | +10.10% |
| Price vs. 200-Day MA ⓘ | +13.17% | +6.44% |
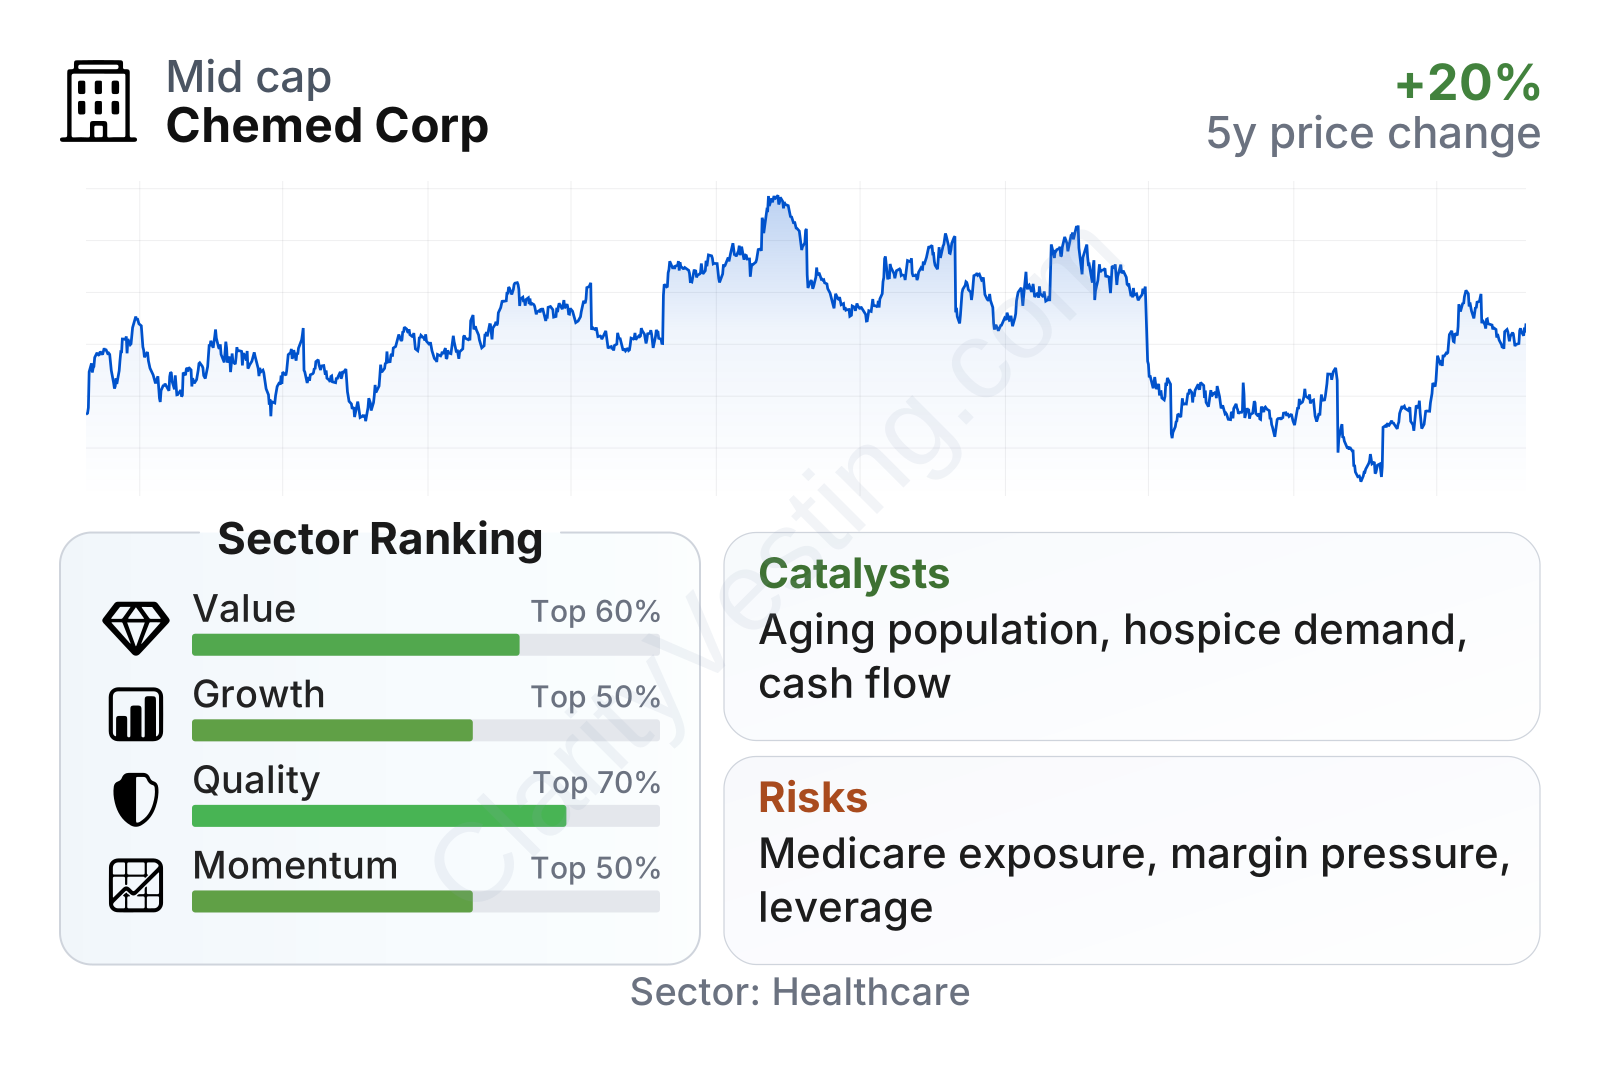
Chemed stands out for business quality more than for deep valuation appeal. Profitability remains clearly above the healthcare sector median, with return on assets, return on invested capital, operating margin, and profit margin all showing a stronger-than-average operating profile. Cash generation is also healthy, and free cash flow yield compares favorably with the sector. On the other hand, the stock’s valuation is not especially low, especially on price-to-book, which reflects that the market has historically assigned a premium to the company’s durable earnings and asset-light characteristics in parts of the business. Share-price behavior has also been less dramatic than many healthcare names, helped by a low beta near 0.5.
Growth
Chemed operates in areas with credible long-term demand support. Hospice care is tied to one of the clearest demographic trends in the U.S.: an aging population with rising need for end-of-life care. That does not guarantee rapid growth every year, but it creates a favorable backdrop for patient volume over time. Roto-Rooter adds a different kind of growth support because plumbing and drain issues do not disappear in weak economic periods; they are often urgent and non-discretionary.
The company’s strategy also makes practical sense. VITAS can grow by expanding admissions, increasing average daily census, and broadening its presence in existing and adjacent markets. Roto-Rooter can grow through local density, brand recognition, technician productivity, and adjacent restoration services. This is not a business dependent on a single breakthrough product. Instead, growth tends to come from execution, local market share gains, and steady demand.
Recent revenue growth has been uneven but generally constructive. After softer periods in 2022, growth improved materially through 2023 and 2024, and the latest year-over-year pace is again running in the high-single-digit range, modestly ahead of the sector median. That suggests the company is still finding room to expand despite the mature nature of both core businesses.
Cash generation is another favorable point. Free cash flow has climbed meaningfully over the last several years and recently moved into the upper $300 million range on a trailing basis. That supports financial flexibility for acquisitions, branch expansion, dividends, and share repurchases without leaning heavily on debt.
A notable recent opportunity is the continued normalization and expansion of hospice utilization, especially as healthcare systems and families increasingly favor lower-cost, home-centered end-of-life care. In parallel, Roto-Rooter remains positioned to benefit from recurring repair demand, aging housing stock, and emergency service needs. Neither catalyst is flashy, but both are grounded in persistent real-world demand.
Risks
This article is for informational purposes only and does not constitute financial advice. Some content is AI-generated. See Disclaimer


