Stock Analysis · Coats Group plc (CGGGF)
Overview
Coats Group plc is a global industrial thread and materials company best known for supplying the textile and footwear industries. Its products are used in apparel, shoes, automotive interiors, bedding, safety applications, and a range of performance materials. While the business sits in textile manufacturing, it is not a simple commodity fabric producer. Coats focuses on specialized thread, structural components for footwear, and engineered materials where reliability, scale, and customer relationships matter.
The company’s revenue base is spread across a few main activities. Based on recent annual reporting and segment disclosures, the mix is approximately as follows:
- Apparel and footwear thread: about 60% to 65% of revenue. This is the core business, supplying sewing thread and related products to global clothing and shoe manufacturers.
- Footwear components: about 20% to 25% of revenue. This includes structural parts and performance materials used in shoes, an area strengthened by acquisitions.
- Performance materials: about 10% to 15% of revenue. This covers higher-specification materials used in automotive, telecom, energy, and other industrial applications.
Geographically, Coats operates across Asia, the Americas, and Europe, the Middle East, and Africa, serving large multinational brands and manufacturers through a broad production and distribution network. That global reach is important because many customers want the same quality and technical standards across multiple countries.
One notable financial pattern in recent years is that revenue has been fairly steady overall, but profitability has improved meaningfully. Gross profit and operating income have risen faster than sales, suggesting a more favorable product mix, pricing discipline, and better cost control.
The business appears to be converting a similar revenue base into better operating earnings than it did a few years ago, which is often a more important signal than sales growth alone for a mature industrial supplier.
Key Figures
| Metric | Value | Sector ⓘ |
|---|---|---|
| Date | Oct 10, 2026 | |
| Context | ||
| Sector | Consumer Cyclical | |
| Industry | Textile Manufacturing | |
| Market Cap ⓘ | $2.03B | |
| Beta ⓘ | 1.21 | |
Value (Cheapness) | ||
| P/E Ratio ⓘ | 17.67 | 16.86 |
| P/B Ratio ⓘ | 2.82 | 1.64 |
| FCF Yield ⓘ | 12.16% | 9.24% |
| Dividend Yield ⓘ | 3.11% | 2.71% |
| EBIT / EV ⓘ | 15.38% | 6.67% |
| PEG ⓘ | 0.72 | |
Growth (Business expansion) | ||
| Revenue Growth ⓘ | 18.60% | 5.65% |
| RPS Growth (5Y CAGR) ⓘ | -3.70% | 8.91% |
| EPS Growth (5Y CAGR) ⓘ | -12.11% | -17.54% |
| BVPS Growth (5Y CAGR) ⓘ | 0.64% | 5.62% |
| Margin Growth (5Y Trend) ⓘ | 7.28% | -0.23% |
| FCF Growth (5Y CAGR) ⓘ | 19.50% | 4.96% |
| DPS Growth (5Y CAGR) ⓘ | 13.53% | 10.03% |
Quality (Business durability) | ||
| ROIC (Latest) ⓘ | 23.98% | 12.38% |
| ROA (Latest) ⓘ | 9.94% | 5.49% |
| ROIC (5Y Median) ⓘ | 12.05% | 10.67% |
| ROA (5Y Median) ⓘ | 4.82% | 5.44% |
| Net Debt / EBIT (Latest) ⓘ | 2.02 | 2.17 |
| Net Debt / EBIT (5Y Median) ⓘ | 2.55 | 2.30 |
| Net Debt / EBITDA (Latest) ⓘ | 1.52 | 1.56 |
| Net Debt / Assets ⓘ | 36.37% | 21.76% |
| EBITDA / Interest ⓘ | 6.65 | 9.06 |
| Operating Margin (Latest) ⓘ | 15.06% | 9.08% |
| Operating Margin (5Y Median) ⓘ | 13.75% | 9.53% |
| Debt to Equity (Latest) ⓘ | 151.37% | 76.00% |
| Profit Margin (Latest) ⓘ | 6.61% | 5.31% |
| Free Cash Flow (Latest) ⓘ | $246.69M | |
Momentum (Price trend) | ||
| 3Y Return ⓘ | +23.38% | +14.94% |
| 12M Return (excl. last month) ⓘ | +1.94% | -0.67% |
| 6M Return ⓘ | +3.40% | 0.00% |
| Price vs. 200-Day MA ⓘ | -1.77% | -3.73% |
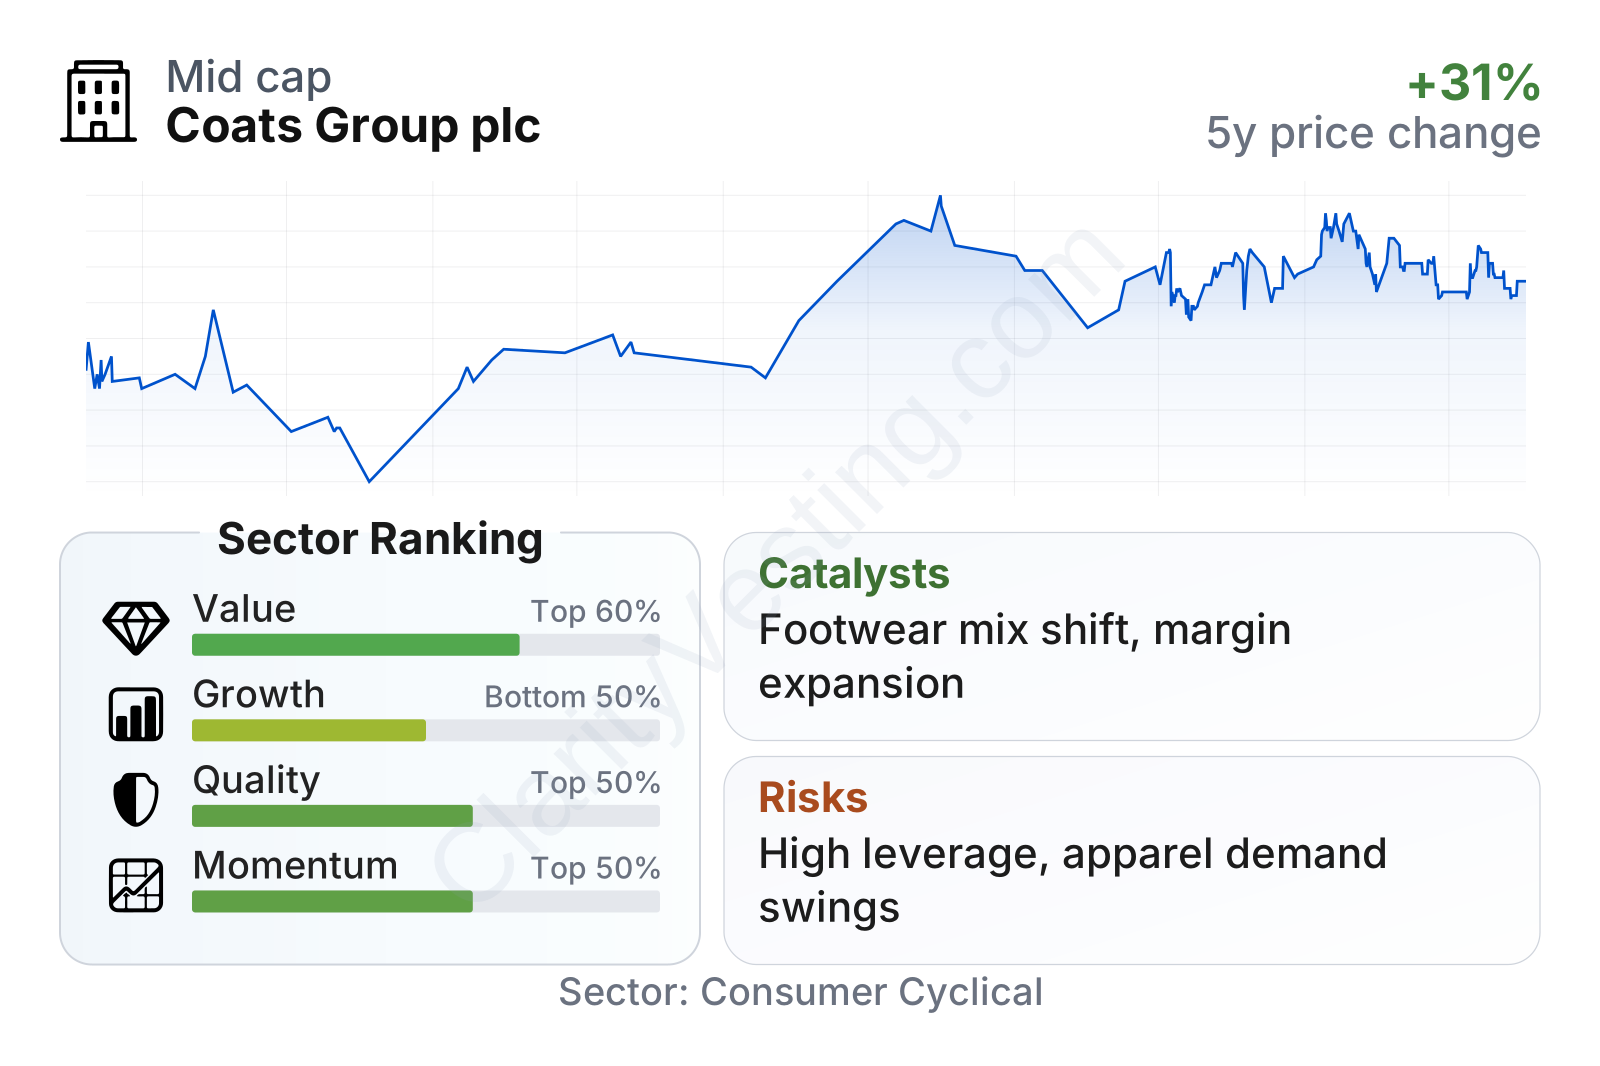
Coats is a mid-sized company with a market value around $2 billion, so it is large enough to have global scale but still small enough for execution improvements to materially change earnings. The share price has moved up over the last several years, although the path has not been smooth, with a noticeable pullback from its 2026 high.
The current metrics paint a mixed but generally solid picture. On valuation, earnings are priced close to the broader sector median, while cash generation looks stronger than average, with free cash flow yield above the sector midpoint and EBIT relative to enterprise value standing out favorably. The PEG ratio below 1 also suggests that the valuation is not demanding relative to the company’s current earnings growth profile.
On quality, profitability is a clear strength. Return on invested capital is around 24%, well above the sector median, and operating margin near 15% is also comfortably ahead of many peers. That indicates Coats is not competing only on volume. It has pricing power in parts of its portfolio and benefits from scale, technical know-how, and customer integration.
The weaker area is the balance sheet structure. Debt to equity is elevated at roughly 151%, clearly above the sector median, even though net debt relative to EBITDA is closer to normal for the industry. In simple terms, the company is not overextended in an immediate sense, but leverage is still an important feature of the equity case and deserves attention.
Growth
Coats operates in end markets that are not uniformly high-growth, but they are large, global, and increasingly demanding in terms of quality, traceability, and product performance. Basic apparel manufacturing is mature, yet footwear innovation, performance materials, and supply-chain consolidation can still create room for growth. That matters because Coats does not need explosive sector expansion to improve results; it needs to keep gaining share, improving mix, and expanding in higher-value categories.
The company’s strategy is coherent for that objective. Management has been building beyond traditional thread into footwear components and engineered materials, where technical requirements and switching costs can be higher. This broadens Coats’ relevance with existing customers and makes the business less dependent on a single product category. It also supports margin expansion because specialized products tend to carry better economics than standard textile inputs.
A key catalyst is the company’s ability to translate acquisitions and portfolio changes into stronger margins and cash flow. Over the last few years, operating income has expanded sharply, even though total revenue has not grown dramatically over the full period. That suggests Coats is becoming a more efficient and higher-quality business rather than just a bigger one.
Recent performance also points to momentum in cash generation. Free cash flow has compounded faster than the sector median over five years, and dividend growth has also been healthy. Even though five-year revenue per share growth remains weak, the latest year-over-year revenue increase is much stronger than the sector median, indicating that near-term growth has improved after a more uneven earlier period.
Another favorable structural factor is customer complexity. Global brands increasingly want suppliers that can provide consistent materials, technical support, and compliance standards across regions. Coats’ manufacturing footprint and long operating history make it relevant in that environment. In footwear and performance materials in particular, this can support deeper customer relationships and create opportunities that smaller rivals may struggle to match.
Risks
This article is for informational purposes only and does not constitute financial advice. Some content is AI-generated. See Disclaimer