Stock Analysis · Citizens Financial Group Inc (CFG)
Overview
Citizens Financial Group is a large U.S. regional bank. It serves consumers, small businesses, middle-market companies, and larger institutions through traditional banking products such as deposits, loans, credit cards, wealth services, and treasury solutions. Its footprint is strongest in the Northeast and Midwest, but it also operates national businesses in areas such as student lending, private banking, capital markets, and wealth management.
Like most banks, Citizens mainly makes money from the spread between what it earns on loans and securities and what it pays on deposits and other funding. It also generates fee income from card activity, capital markets, advisory work, wealth management, mortgage banking, and service charges. Based on recent annual reporting, the main sources of revenue can be summarized as follows:
- Net interest income: approximately 60% to 70% of total revenue. This is the core banking engine and reflects lending across commercial, consumer, mortgage, education, and other portfolios, funded largely by deposits.
- Capital markets, advisory, and underwriting fees: approximately 10% to 15%. This includes debt and equity underwriting, mergers and acquisitions advisory, loan syndication, foreign exchange, and related institutional services.
- Card fees, service charges, and deposit-related fees: approximately 8% to 12%. This comes from debit and credit card activity, account fees, and transaction services.
- Wealth management, private banking, and investment services: approximately 5% to 10%. These activities produce recurring fees tied to assets under management, planning, brokerage, and trust services.
- Mortgage banking and other noninterest income: approximately 5% to 10%. This includes home lending-related fees and a mix of smaller service and market-related revenue lines.
That mix matters for long-term analysis. A bank that relies only on loan spreads is more exposed to interest-rate swings, while Citizens has been trying to build a broader fee base through commercial services, wealth, and capital markets. Even so, spread income remains the dominant driver.
Over the last several years, revenue expanded materially, but profit conversion has been uneven. Interest expense rose sharply during the higher-rate period, operating costs also climbed, and net income did not keep pace with top-line growth. More recently, profitability has shown signs of stabilization, but the path has been bumpier than the revenue line alone suggests.
Key Figures
| Metric | Value | Sector ⓘ |
|---|---|---|
| Date | Oct 20, 2026 | |
| Context | ||
| Sector | Financial Services | |
| Industry | Banks - Regional | |
| Market Cap ⓘ | $26.43B | |
| Beta ⓘ | 1.06 | |
Value (Cheapness) | ||
| P/E Ratio ⓘ | 13.67 | 12.26 |
| P/B Ratio ⓘ | 1.06 | 1.23 |
| FCF Yield ⓘ | 8.90% | 10.33% |
| Dividend Yield ⓘ | N/A | 3.02% |
| EBIT / EV ⓘ | 8.76% | 8.14% |
| PEG ⓘ | 1.65 | |
Growth (Business expansion) | ||
| Revenue Growth ⓘ | 14.70% | 9.25% |
| RPS Growth (5Y CAGR) ⓘ | 11.87% | 12.19% |
| EPS Growth (5Y CAGR) ⓘ | -5.94% | -8.95% |
| BVPS Growth (5Y CAGR) ⓘ | 4.81% | 4.99% |
| Margin Growth (5Y Trend) ⓘ | -21.73% | -3.86% |
| FCF Growth (5Y CAGR) ⓘ | -1.35% | 4.81% |
| DPS Growth (5Y CAGR) ⓘ | 2.72% | 8.79% |
Quality (Business durability) | ||
| ROIC (Latest) ⓘ | 5.80% | 9.49% |
| ROE (Latest) ⓘ | 8.66% | 13.87% |
| ROA (Latest) ⓘ | 0.98% | 1.54% |
| ROIC (5Y Median) ⓘ | 5.23% | 7.86% |
| ROE (5Y Median) ⓘ | 6.68% | 12.17% |
| ROA (5Y Median) ⓘ | 0.83% | 1.30% |
| Net Debt / EBIT (Latest) ⓘ | 1.32 | 0.99 |
| Net Debt / EBIT (5Y Median) ⓘ | 0.62 | 0.73 |
| Net Debt / EBITDA (Latest) ⓘ | 1.33 | 0.91 |
| Operating Margin (Latest) ⓘ | 23.64% | 22.30% |
| Operating Margin (5Y Median) ⓘ | 20.88% | 24.63% |
| Debt to Equity (Latest) ⓘ | 70.87% | 58.32% |
| Profit Margin (Latest) ⓘ | 26.05% | 26.57% |
| Free Cash Flow (Latest) ⓘ | $2.35B | |
Momentum (Price trend) | ||
| 3Y Return ⓘ | +197.99% | +88.67% |
| 12M Return (excl. last month) ⓘ | +28.96% | +19.19% |
| 6M Return ⓘ | -1.28% | +4.70% |
| Price vs. 200-Day MA ⓘ | -3.25% | +3.66% |
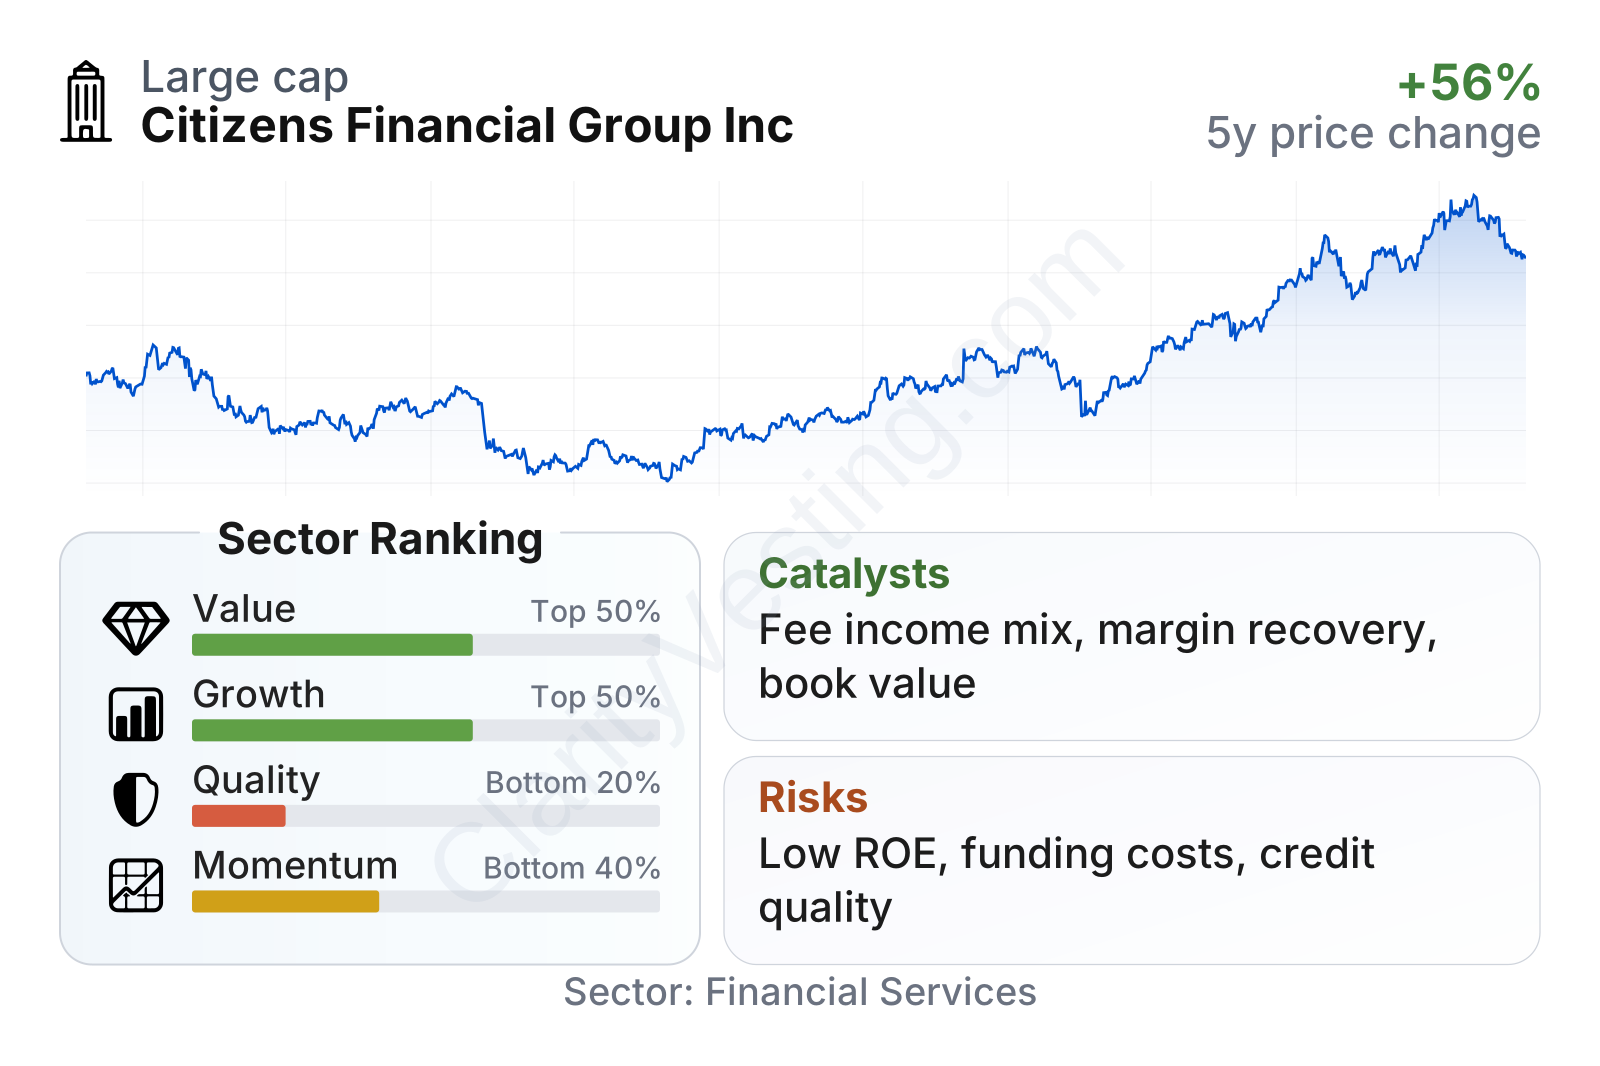
Citizens is a large regional bank with a market value in the tens of billions of dollars and share-price volatility close to the broader market. On valuation, it sits around the middle of the banking pack: earnings multiples are slightly above the sector median, while price-to-book remains below the sector median. Growth metrics are mixed but generally respectable, especially recent revenue growth. The weak spot is quality: returns on equity and assets remain below many peers, and leverage is somewhat higher than the median. Price momentum has been strong over three years, but shorter-term trading has cooled.
The stock history also shows how sharply sentiment can change for banks. Citizens fell heavily during the 2023 regional banking stress, then recovered strongly through 2024 to 2026. That rebound suggests confidence has improved, but it also means the shares are no longer trading at the deep discount seen during the panic period.
Growth
Citizens operates in a mature sector rather than a high-growth one. Banking growth usually comes from loan expansion, customer acquisition, fee-based services, disciplined pricing, and acquisitions rather than from rapid industry-wide expansion. That means the long-term case depends less on a booming market and more on whether management can steadily improve returns, expand attractive niches, and keep funding costs under control.
Its strategy broadly makes sense for that environment. Citizens has been emphasizing commercial banking, treasury services, private banking, wealth management, and capital markets capabilities. Those areas can deepen customer relationships and add fee income that is less dependent on interest-rate spreads. The company has also used acquisitions in recent years to strengthen specialized capabilities, particularly in wealth and advisory businesses, which can support a more diversified earnings base over time.
Earnings per share illustrate both the challenge and the opportunity. EPS declined from the unusually strong 2021 level through 2024, then improved in 2025, indicating that the bank was absorbing pressure from funding costs, margin compression, and a tougher credit backdrop before beginning to recover. For a long-term view, the key question is not whether earnings were temporarily weak, but whether the rebound can continue as deposit costs normalize and fee businesses scale further.
Book value per share presents a steadier picture. After dipping in 2022, it has moved higher and reached a meaningfully stronger level by 2025. For banks, book value is an important anchor because it reflects the underlying equity base supporting lending and earnings. A rising book value alongside recovering earnings usually points to a business that is rebuilding financial strength after a difficult part of the cycle.
One practical catalyst is the interest-rate backdrop. If deposit pricing pressure eases faster than asset yields decline, Citizens could see better net interest income and improved margins. Another catalyst is stronger activity in capital markets and advisory work, which tends to benefit when business confidence and financing activity improve. Continued growth in wealth and private banking could also help because those lines typically produce recurring fee income and can raise the quality of earnings over time.
Recent company updates have also pointed to ongoing balance-sheet management, efficiency actions, and business mix improvement. None of these are transformational on their own, but together they support a reasonable case for gradual earnings normalization rather than dramatic expansion.
Risks
This article is for informational purposes only and does not constitute financial advice. Some content is AI-generated. See Disclaimer


