Stock Analysis · Central Securities Corporation (CET)
Overview
Central Securities Corporation is a closed-end investment company. In simple terms, it is a publicly traded portfolio that owns stakes in other businesses and securities. Rather than operating a large industrial or consumer business itself, Central Securities creates value mainly through investment returns, dividends and interest received from its holdings, and changes in the market value of those holdings.
The company has a long history and is relatively small compared with the largest asset managers, but its structure is distinctive: shareholders are buying into an internally managed investment vehicle with a concentrated portfolio, not a broad financial supermarket. Public filings show that the portfolio includes both publicly traded securities and a meaningful privately held investment, which makes the company different from many standard funds.
Its economic sources of income can be described as follows:
- Net investment gains and changes in portfolio value: this is typically the largest driver over time, although it can swing sharply from year to year because it depends on market conditions and valuation changes in the holdings.
- Dividend income from portfolio companies: an important recurring source of cash generation, especially because part of the portfolio is invested in established dividend-paying businesses.
- Interest and other investment income: usually a smaller contributor, coming from cash balances, short-term instruments, and other investment-related income streams.
Because Central Securities is an investment company, exact revenue mix percentages are not especially stable or meaningful in the same way they would be for an operating company. Results can change materially depending on realized gains, unrealized appreciation, and the timing of portfolio transactions.
The profit structure is unusual in a good way: operating expenses have remained low relative to the size of the investment base, and the business uses very little debt. That means a large part of portfolio performance can flow through to net asset value rather than being absorbed by financing costs.
The long-term pattern shows a business with very low operating costs but highly variable reported revenue, which is normal for a portfolio-driven company. The main takeaway is that performance is shaped much more by investment results than by expense control, although cost discipline appears strong.
Key Figures
| Metric | Value | Sector ⓘ |
|---|---|---|
| Date | Oct 24, 2026 | |
| Context | ||
| Sector | Financial Services | |
| Industry | Asset Management | |
| Market Cap ⓘ | $1.67B | |
| Beta ⓘ | 0.75 | |
Value (Cheapness) | ||
| P/E Ratio ⓘ | 7.61 | 12.46 |
| P/B Ratio ⓘ | 0.91 | 1.25 |
| FCF Yield ⓘ | 3.27% | 9.82% |
| Dividend Yield ⓘ | 4.90% | 2.94% |
| EBIT / EV ⓘ | 25.79% | 8.11% |
| PEG ⓘ | N/A | |
Growth (Business expansion) | ||
| Revenue Growth ⓘ | 65.90% | 9.10% |
| RPS Growth (5Y CAGR) ⓘ | -30.97% | 12.31% |
| EPS Growth (5Y CAGR) ⓘ | -2.46% | -6.97% |
| BVPS Growth (5Y CAGR) ⓘ | 5.99% | 5.02% |
| Margin Growth (5Y Trend) ⓘ | 206.89% | -4.00% |
| FCF Growth (5Y CAGR) ⓘ | -4.86% | 4.71% |
| DPS Growth (5Y CAGR) ⓘ | -6.81% | 8.92% |
Quality (Business durability) | ||
| ROIC (Latest) ⓘ | N/A | 9.18% |
| ROE (Latest) ⓘ | 25.33% | 13.93% |
| ROA (Latest) ⓘ | 25.28% | 1.57% |
| ROIC (5Y Median) ⓘ | N/A | 7.80% |
| ROE (5Y Median) ⓘ | 18.24% | 12.15% |
| ROA (5Y Median) ⓘ | 18.19% | 1.28% |
| Net Debt / EBIT (Latest) ⓘ | 0.01 | 1.02 |
| Net Debt / EBIT (5Y Median) ⓘ | 0.00 | 0.72 |
| Net Debt / EBITDA (Latest) ⓘ | 0.01 | 0.88 |
| Operating Margin (Latest) ⓘ | 220.71% | 22.30% |
| Operating Margin (5Y Median) ⓘ | 103.95% | 24.50% |
| Debt to Equity (Latest) ⓘ | 0.14% | 59.34% |
| Profit Margin (Latest) ⓘ | 503.50% | 26.42% |
| Free Cash Flow (Latest) ⓘ | $54.55M | |
Momentum (Price trend) | ||
| 3Y Return ⓘ | +85.33% | +95.73% |
| 12M Return (excl. last month) ⓘ | +16.48% | +17.30% |
| 6M Return ⓘ | +7.17% | +6.07% |
| Price vs. 200-Day MA ⓘ | +6.33% | +5.36% |
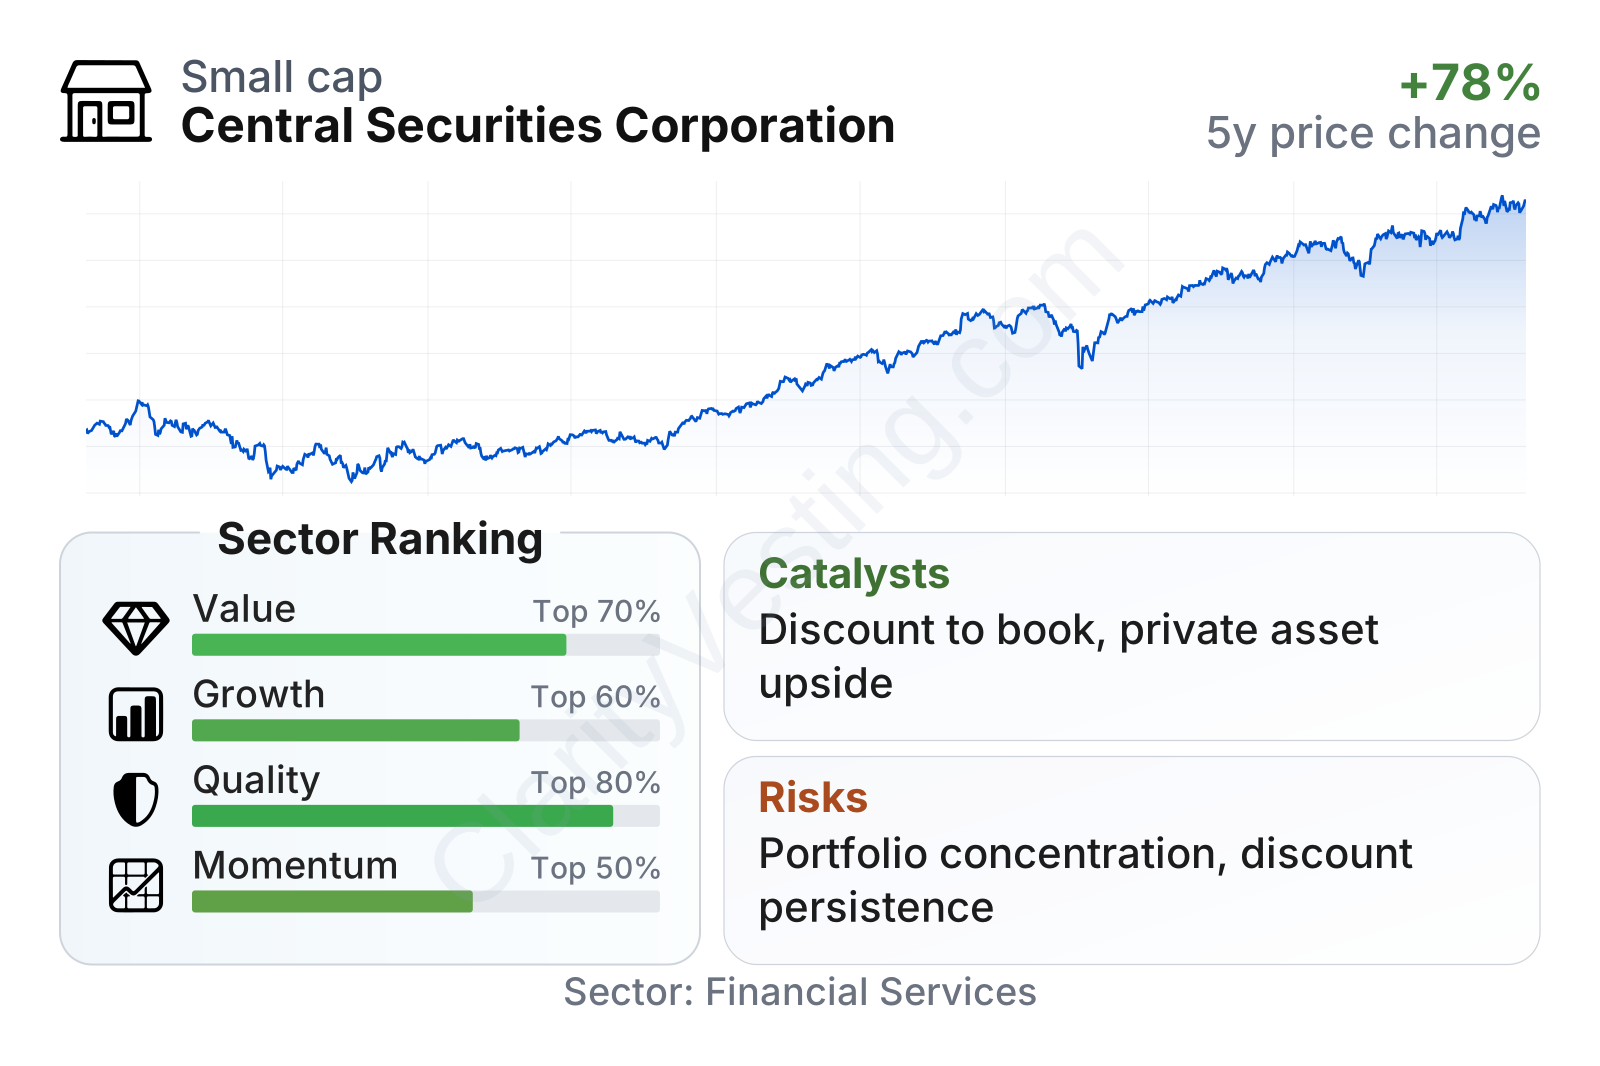
Central Securities stands out for strong profitability and balance-sheet conservatism, while growth and market momentum look less consistent. Relative to much of the financial sector, the stock trades on lower earnings and book multiples, offers a higher dividend yield, and operates with almost no leverage. The weaker area is that long-term revenue-related growth has been uneven, which fits the nature of an investment portfolio rather than a steadily expanding operating business.
The share price trend over the last several years has generally been upward, though not in a straight line. That path reflects both the underlying portfolio performance and the market’s view of the discount or premium applied to the company’s net assets.
Growth
Central Securities does not sit in a classic high-growth segment of financial services. Closed-end funds and investment companies usually grow more through disciplined capital allocation and net asset value compounding than through rapid customer expansion. So the real growth question is whether management can keep increasing book value per share, support distributions, and improve the value of the underlying portfolio over time.
That strategy can still make sense for long-term growth. The company’s internal management structure helps keep expenses low, and low expenses matter a lot in investment businesses because they leave more of the portfolio’s return for shareholders. Another supportive element is the company’s strong financial position: minimal debt gives it resilience during market downturns and keeps it from being forced into difficult financing decisions.
Earnings have been volatile, which is expected for a company whose reported results depend on gains and losses in investments. The key point is not smooth year-to-year earnings, but whether profitability recovers after weak markets and whether the portfolio continues to generate attractive long-run returns.
Book value per share is especially important here because it is a close proxy for the underlying value of the investment portfolio. The long-term direction has been positive despite setbacks, and the five-year growth rate is slightly ahead of the sector median. That suggests the company has still been compounding intrinsic value over time, even if the path has been uneven.
A notable catalyst is the portfolio’s exposure to privately held assets alongside public securities. If those private holdings continue to grow in value or if there is a liquidity event such as a sale, recapitalization, or public offering, the market could reassess the company’s underlying asset value. Another potential catalyst is narrowing of the discount between the stock price and book value, since the shares have recently traded below book while the portfolio itself has continued to build value.
Recent operating trends also show a sharp rebound in year-over-year revenue-related measures after earlier volatility. For a portfolio company, that mainly signals better investment conditions and stronger appreciation in holdings rather than a structural change in business model, but it still points to improved near-term fundamentals.
Risks
This article is for informational purposes only and does not constitute financial advice. Some content is AI-generated. See Disclaimer


