Stock Analysis · CECO Environmental Corp (CECO)
Overview
CECO Environmental Corp is an industrial company focused on helping customers control emissions, treat contaminated air and water, and improve efficiency in complex operating environments. Its products and services are used in markets such as industrial manufacturing, power generation, semiconductor production, natural gas infrastructure, energy transition projects, and water-related applications. In simple terms, CECO sells equipment and engineered systems that help facilities run cleaner, meet regulations, and protect critical processes.
The company’s revenue comes mainly from environmental systems and industrial process solutions sold to business customers. Based on recent company reporting, revenue is broadly organized around two main segments.
- Engineered Systems: approximately 65% to 75% of revenue in recent periods. This segment includes larger custom systems such as air pollution control, thermal and separation solutions, energy and water process equipment, and other engineered products used in industrial and infrastructure projects.
- Industrial Process Solutions: approximately 25% to 35% of revenue in recent periods. This segment includes pumps, filtration, ducting, fluid handling, and related replacement parts and services that support recurring plant operations.
That mix matters because the larger engineered projects can accelerate growth when order activity is strong, while the more day-to-day process solutions business can add steadier replacement and service demand. Over the last several years, CECO has also expanded through acquisitions, which has increased its exposure to higher-growth end markets such as semiconductors, industrial air, and water technologies.
Looking at the business flow over time, revenue has climbed sharply from a little above $300 million in 2021 to well above $700 million in 2025. Gross profit has also expanded, and operating income improved materially in 2025 after a softer 2024. The broad picture is of a company that has become much larger, but with earnings still showing some unevenness from integration costs, project timing, and margin swings.
Key Figures
| Metric | Value | Sector ⓘ |
|---|---|---|
| Date | Oct 24, 2026 | |
| Context | ||
| Sector | Industrials | |
| Industry | Pollution & Treatment Controls | |
| Market Cap ⓘ | $3.44B | |
| Beta ⓘ | 1.50 | |
Value (Cheapness) | ||
| P/E Ratio ⓘ | N/A | 22.29 |
| P/B Ratio ⓘ | 1.22 | 1.98 |
| FCF Yield ⓘ | -0.33% | 6.26% |
| Dividend Yield ⓘ | N/A | 1.92% |
| EBIT / EV ⓘ | -0.03% | 4.83% |
| PEG ⓘ | 1.44 | |
Growth (Business expansion) | ||
| Revenue Growth ⓘ | 53.70% | 9.30% |
| RPS Growth (5Y CAGR) ⓘ | 23.46% | 7.76% |
| EPS Growth (5Y CAGR) ⓘ | 3.48% | -13.17% |
| BVPS Growth (5Y CAGR) ⓘ | 10.35% | 6.13% |
| Margin Growth (5Y Trend) ⓘ | 9.68% | 0.74% |
| FCF Growth (5Y CAGR) ⓘ | N/A | 10.79% |
| DPS Growth (5Y CAGR) ⓘ | -35.45% | 9.41% |
Quality (Business durability) | ||
| ROIC (Latest) ⓘ | -0.93% | 10.75% |
| ROA (Latest) ⓘ | -1.17% | 5.41% |
| ROIC (5Y Median) ⓘ | 6.98% | 9.37% |
| ROA (5Y Median) ⓘ | 2.34% | 4.95% |
| Net Debt / EBIT (Latest) ⓘ | N/A | 2.04 |
| Net Debt / EBIT (5Y Median) ⓘ | 2.88 | 2.27 |
| Net Debt / EBITDA (Latest) ⓘ | 22.48 | 1.39 |
| Net Debt / Assets ⓘ | 18.79% | 19.27% |
| EBITDA / Interest ⓘ | 1.32 | 9.58 |
| Operating Margin (Latest) ⓘ | -0.18% | 10.49% |
| Operating Margin (5Y Median) ⓘ | 6.41% | 10.30% |
| Debt to Equity (Latest) ⓘ | 36.74% | 64.82% |
| Profit Margin (Latest) ⓘ | -3.39% | 6.67% |
| Free Cash Flow (Latest) ⓘ | -$11.39M | |
Momentum (Price trend) | ||
| 3Y Return ⓘ | +269.84% | +67.77% |
| 12M Return (excl. last month) ⓘ | +46.31% | +12.05% |
| 6M Return ⓘ | -5.24% | 0.00% |
| Price vs. 200-Day MA ⓘ | -19.42% | +0.67% |
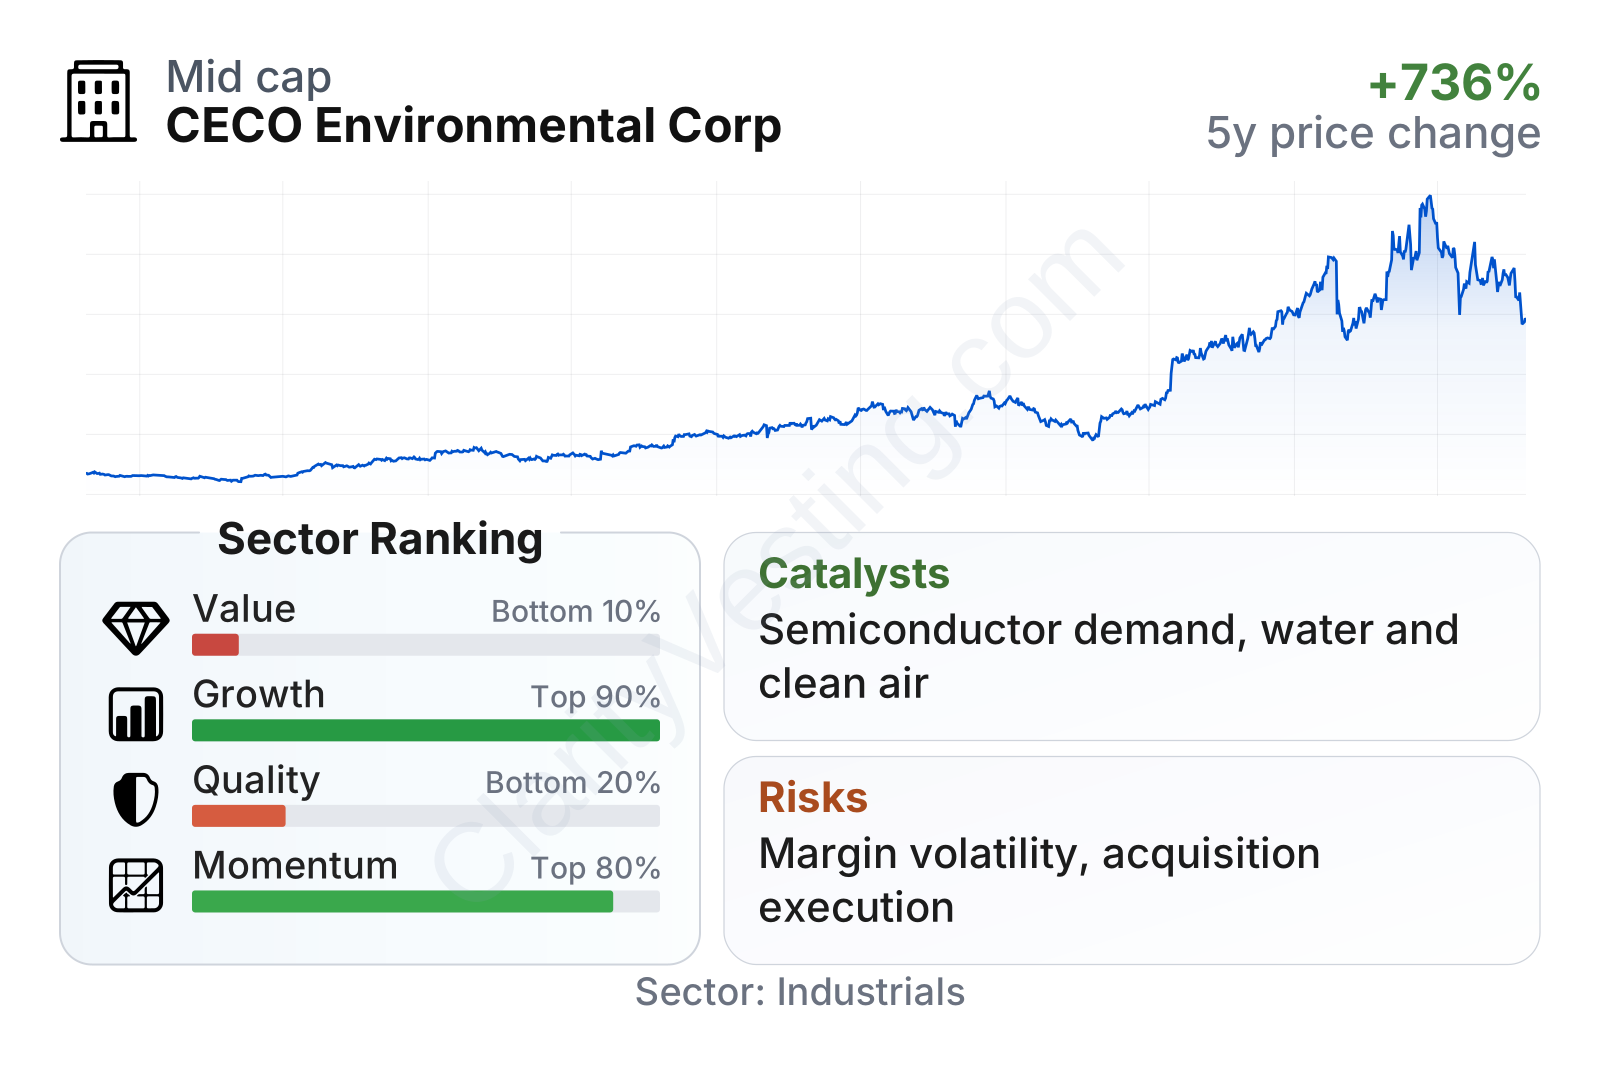
CECO is now a mid-sized industrial company with a market value around $4 billion, which is much larger than it was only a few years ago. The stock has shown very strong momentum over one-, three-, and multi-year periods, reflecting both business expansion and a much richer market valuation. At the same time, the factor profile is mixed: growth and momentum rank very well versus the broader industrial sector, while value and quality rank near the bottom. In practical terms, the market is placing a premium on expansion, but current profitability and cash generation are not as strong as that premium would normally imply.
Another notable point is volatility. A beta above 1.5 suggests the shares have tended to move more than the market, which fits the stock’s sharp rise and occasional setbacks. This is not unusual for a smaller industrial company that is scaling through acquisitions and project-driven demand, but it does mean the path has been less stable than the long-term stock chart alone might suggest.
Growth
CECO operates in a part of the industrial market that benefits from several durable trends: tighter environmental standards, factory modernization, increasing demand for cleaner process technologies, semiconductor capital spending, water treatment needs, and infrastructure tied to energy transition. These are not short-lived themes. Many of CECO’s customers face regulatory pressure or process requirements that make pollution control, filtration, separation, and water handling essential rather than optional.
The company’s strategy also fits these trends reasonably well. Management has been repositioning the portfolio toward higher-growth, more specialized niches where customers value engineering know-how and mission-critical performance. Acquisitions have played a central role in that approach, helping CECO expand its product set and enter markets with better long-term demand than some of its older legacy businesses.
Recent top-line performance has been strong. Revenue growth has been consistently above the sector median over the last several years, and the most recent year-over-year readings show a clear reacceleration after a slower patch in 2024. That suggests demand remains healthy and that the company is still benefiting from prior acquisitions, project wins, and broader end-market exposure. Over a five-year view, revenue per share growth has also been well ahead of the typical industrial peer, which supports the idea that CECO has been expanding faster than much of its sector.
Cash generation, however, tells a more nuanced story. Free cash flow has been positive at points and reached much stronger levels in 2024, but it has also come down sharply since then and is currently weak on a trailing basis. For a company in expansion mode, that can happen when working capital rises, integration spending is elevated, or larger projects temporarily absorb cash before payment is collected. It does not erase the growth case, but it does mean the quality of that growth deserves close attention.
A meaningful catalyst is CECO’s exposure to high-specification industrial and clean-process markets where customer requirements are strict and switching costs can be meaningful. Semiconductor-related air handling and filtration, industrial water applications, and environmental control systems for regulated industries all offer room for continued demand. Recent company communications have also emphasized backlog, acquisitions, and portfolio positioning around higher-margin and higher-growth platforms, which points to a business still in active buildout rather than one that has reached maturity.
Risks
This article is for informational purposes only and does not constitute financial advice. Some content is AI-generated. See Disclaimer


