Stock Analysis · Celanese Corporation (CE)
Overview
Celanese Corporation is a global chemicals and specialty materials company. It makes engineered polymers, acetyl products, and other chemical ingredients that are used by industrial customers rather than sold directly to consumers. Its materials can end up in automotive parts, medical devices, paints, coatings, construction products, consumer goods, electronics, and many other applications.
The business is organized around two main operating segments. Based on the latest annual filing, revenue is primarily split as follows:
- Engineered Materials: about 58% of revenue. This segment sells specialty thermoplastics and polymer compounds used in transportation, medical, consumer, industrial, and electronics applications. It became more important after the large Mobility & Materials acquisition from DuPont.
- Acetyl Chain: about 42% of revenue. This includes acetic acid, vinyl acetate monomer, emulsions, redispersible powders, and related downstream products used in paints, adhesives, construction, textiles, and industrial processes.
That mix matters because Engineered Materials is intended to provide more differentiated products and better pricing power, while Acetyl Chain is more exposed to commodity-like cycles in chemical markets and raw material costs.
Over the last several years, sales expanded meaningfully through acquisition, but profit conversion weakened sharply. Revenue stayed near the $9 billion to $11 billion range, while operating income and net income turned negative in 2024 and remained under pressure in 2025. Interest expense also rose materially, showing how much the capital structure changed after the company’s deal activity.
The broad picture is a company with large industrial reach and useful product niches, but with a business model currently strained by weaker margins, restructuring, and heavy financing costs.
Key Figures
| Metric | Value | Sector ⓘ |
|---|---|---|
| Date | Oct 24, 2026 | |
| Context | ||
| Sector | Basic Materials | |
| Industry | Chemicals | |
| Market Cap ⓘ | $5.22B | |
| Beta ⓘ | 0.76 | |
Value (Cheapness) | ||
| P/E Ratio ⓘ | N/A | 16.92 |
| P/B Ratio ⓘ | 1.39 | 1.66 |
| FCF Yield ⓘ | 13.58% | 5.83% |
| Dividend Yield ⓘ | 0.25% | 2.07% |
| EBIT / EV ⓘ | -2.79% | 6.38% |
| PEG ⓘ | 4.42 | |
Growth (Business expansion) | ||
| Revenue Growth ⓘ | 8.70% | 11.25% |
| RPS Growth (5Y CAGR) ⓘ | 3.43% | 4.49% |
| EPS Growth (5Y CAGR) ⓘ | -34.27% | -15.24% |
| BVPS Growth (5Y CAGR) ⓘ | -0.85% | 5.49% |
| Margin Growth (5Y Trend) ⓘ | -32.12% | -1.54% |
| FCF Growth (5Y CAGR) ⓘ | -11.18% | 0.37% |
| DPS Growth (5Y CAGR) ⓘ | -54.26% | 5.91% |
Quality (Business durability) | ||
| ROIC (Latest) ⓘ | -0.36% | 9.59% |
| ROA (Latest) ⓘ | -5.37% | 4.92% |
| ROIC (5Y Median) ⓘ | 15.45% | 7.91% |
| ROA (5Y Median) ⓘ | 7.41% | 3.92% |
| Net Debt / EBIT (Latest) ⓘ | N/A | 1.36 |
| Net Debt / EBIT (5Y Median) ⓘ | 6.46 | 1.69 |
| Net Debt / EBITDA (Latest) ⓘ | 28.47 | 0.93 |
| Net Debt / Assets ⓘ | 51.20% | 13.69% |
| EBITDA / Interest ⓘ | 0.51 | 12.38 |
| Operating Margin (Latest) ⓘ | -4.71% | 13.24% |
| Operating Margin (5Y Median) ⓘ | 17.39% | 11.82% |
| Debt to Equity (Latest) ⓘ | 295.75% | 40.30% |
| Profit Margin (Latest) ⓘ | -12.04% | 6.38% |
| Free Cash Flow (Latest) ⓘ | $708.00M | |
Momentum (Price trend) | ||
| 3Y Return ⓘ | -57.73% | +73.47% |
| 12M Return (excl. last month) ⓘ | +0.53% | +27.59% |
| 6M Return ⓘ | -28.05% | -4.02% |
| Price vs. 200-Day MA ⓘ | -8.11% | -0.65% |
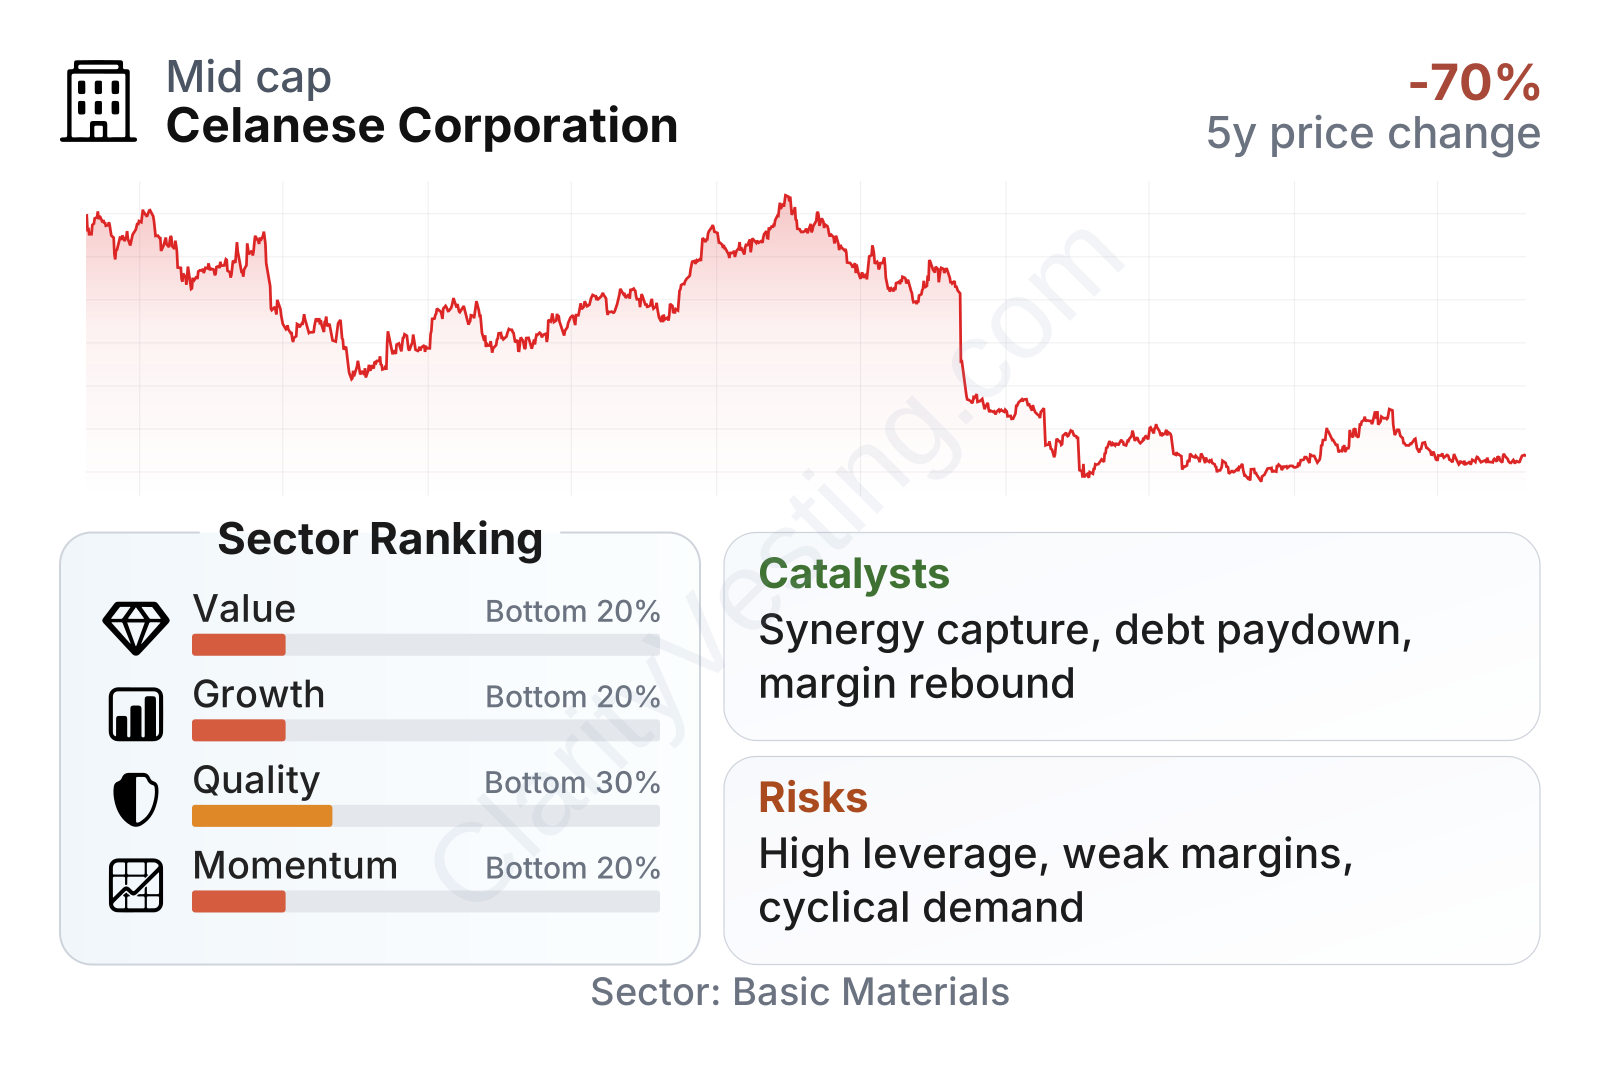
Celanese is now a mid-sized chemicals company by market value, and the stock has been extremely weak over the last three years despite some rebounds along the way. The table points to a mixed profile: valuation screens look inexpensive on measures tied to cash generation and book value, but growth, profitability, balance-sheet quality, and share-price momentum all rank near the lower end of the sector. In simple terms, the market is assigning a low price because operating performance has deteriorated and leverage remains unusually high.
Growth
Celanese operates in markets that should still have long-term demand. Specialty polymers, lightweight auto materials, medical-grade compounds, and formulation chemicals all benefit from broad trends such as vehicle efficiency, electrification, product miniaturization, and substitution of metal or heavier materials with advanced polymers. That does not make the company part of a fast-growth industry, but it does place it in end markets where technical materials remain relevant and often necessary.
The strategy also makes industrial sense on paper. Management has aimed to build a larger specialty materials platform, cross-sell products through a broader customer network, and capture cost synergies from the DuPont Mobility & Materials acquisition. If execution improves, that strategy could lift margins because engineered materials generally carry better economics than more commodity-exposed chemicals.
Recent revenue trends suggest the downturn may be easing, but not fully resolved. Year-over-year sales growth was strongly positive in 2022 and 2023, then turned negative through much of 2024 and 2025 before returning to modest growth in the most recent period. That pattern fits a company moving through a cyclical slump rather than one enjoying a clean growth runway.
Cash generation is an important counterweight. Free cash flow has been volatile, but it remains substantial in absolute dollars and improved from the weakest recent levels. For a company under earnings pressure, that matters because cash flow helps fund debt reduction, restructuring, and core operations. A visible improvement in free cash flow would be one of the clearest signs that the business is stabilizing.
A major catalyst is the company’s self-help plan: cost reductions, integration benefits, portfolio optimization, and a focus on higher-value applications. Another practical opportunity is any recovery in auto production, industrial demand, and construction-related chemical consumption. Because margins have fallen so far from earlier levels, even a moderate improvement in volumes or pricing could have an outsized effect on earnings.
Recent company updates have also emphasized actions to improve productivity, reduce costs, and preserve cash. For Celanese, that is more significant than headline expansion plans. At this stage, restoring profitability is the most meaningful growth bridge.
Risks
This article is for informational purposes only and does not constitute financial advice. Some content is AI-generated. See Disclaimer


