Stock Analysis · Capital & Counties Properties PLC (CCPPF)
Overview
Capital & Counties Properties PLC, now commonly known as Shaftesbury Capital after its combination of major central London property interests, is a U.K.-listed real estate company focused on owning, managing, and improving destination assets in London. Its portfolio is concentrated in some of the city’s best-known districts, especially the West End and Covent Garden, where the company benefits from dense foot traffic, tourism, office activity, food and beverage demand, and luxury as well as mass-market retail spending.
The business model is relatively simple: it owns buildings in high-value urban locations, leases space to tenants, captures rental income, and aims to increase the long-term value of those properties through redevelopment, active leasing, tenant mix management, and selective disposals or acquisitions. Because these are prime mixed-use neighborhoods rather than standard shopping centers, the company’s earnings are influenced not only by retail conditions but also by hospitality, leisure, offices, and the valuation of its real estate.
Based on recent annual reporting, its revenue mix is led by rental and related property income, while profit can also be materially affected by changes in property values. A practical way to think about the business is:
- Rental income from retail space – the largest source, driven by shops and flagship units in central London destinations.
- Food, beverage, and leisure leasing – an important and growing part of the tenant base, including restaurants, cafés, bars, and entertainment uses.
- Office leasing – a smaller but meaningful contributor, mainly from mixed-use assets in the same districts.
- Residential and other property income – a relatively small revenue stream compared with commercial rents.
- Property revaluation gains or losses – not a recurring revenue line in the same sense as rent, but often a major driver of reported profit in any given year.
By reported property value rather than accounting revenue, the portfolio is heavily concentrated in Covent Garden and the broader West End, making the company much more focused than diversified global real estate groups. That concentration is a defining feature: it creates exposure to some of the highest-quality urban real estate in Europe, but it also ties results closely to the health of central London.
Over the past several years, revenue has generally moved upward, while profitability has swung more sharply because property valuations can rise or fall with market conditions. The overall pattern has been improving income generation from the underlying estate, alongside periodic volatility in bottom-line earnings that is normal for property companies using fair-value accounting.
The operating picture has improved meaningfully since 2021, with revenue and gross profit rising, while net income has been much more volatile because revaluation movements and financing costs can overwhelm the steadier rental base in any single year.
Key Figures
| Metric | Value | Sector ⓘ |
|---|---|---|
| Date | Oct 17, 2026 | |
| Context | ||
| Sector | Real Estate | |
| Industry | REIT - Retail | |
| Market Cap ⓘ | $3.30B | |
| Beta ⓘ | 0.96 | |
Value (Cheapness) | ||
| P/E Ratio ⓘ | 6.43 | 17.38 |
| P/B Ratio ⓘ | 1.07 | 0.85 |
| FCF Yield ⓘ | 4.78% | 7.38% |
| Dividend Yield ⓘ | 2.39% | 4.85% |
| EBIT / EV ⓘ | N/A | 3.78% |
| PEG ⓘ | N/A | |
Growth (Business expansion) | ||
| Revenue Growth ⓘ | 4.30% | 5.30% |
| RPS Growth (5Y CAGR) ⓘ | 1.74% | 6.02% |
| EPS Growth (5Y CAGR) ⓘ | N/A | -11.37% |
| BVPS Growth (5Y CAGR) ⓘ | -10.44% | 0.45% |
| Margin Growth (5Y Trend) ⓘ | 103.04% | -0.22% |
| FCF Growth (5Y CAGR) ⓘ | 290.60% | 5.40% |
| DPS Growth (5Y CAGR) ⓘ | 54.77% | 5.02% |
Quality (Business durability) | ||
| ROIC (Latest) ⓘ | N/A | 5.69% |
| ROE (Latest) ⓘ | 18.01% | 7.56% |
| ROA (Latest) ⓘ | 12.72% | 2.85% |
| ROIC (5Y Median) ⓘ | 2.47% | 4.22% |
| ROE (5Y Median) ⓘ | 7.05% | 6.03% |
| ROA (5Y Median) ⓘ | 4.83% | 2.44% |
| Net Debt / EBIT (Latest) ⓘ | 1.33 | 7.59 |
| Net Debt / EBIT (5Y Median) ⓘ | 9.69 | 8.40 |
| Net Debt / EBITDA (Latest) ⓘ | 1.33 | 5.27 |
| Net Debt / Assets ⓘ | 14.62% | 37.76% |
| EBITDA / Interest ⓘ | 4.26 | 4.10 |
| Operating Margin (Latest) ⓘ | 133.26% | 35.29% |
| Operating Margin (5Y Median) ⓘ | 89.24% | 37.31% |
| Debt to Equity (Latest) ⓘ | 23.48% | 88.87% |
| Profit Margin (Latest) ⓘ | 156.72% | 19.61% |
| Free Cash Flow (Latest) ⓘ | $157.42M | |
Momentum (Price trend) | ||
| 3Y Return ⓘ | +34.27% | +30.75% |
| 12M Return (excl. last month) ⓘ | -14.51% | +4.36% |
| 6M Return ⓘ | +6.36% | -2.52% |
| Price vs. 200-Day MA ⓘ | +2.07% | -2.34% |
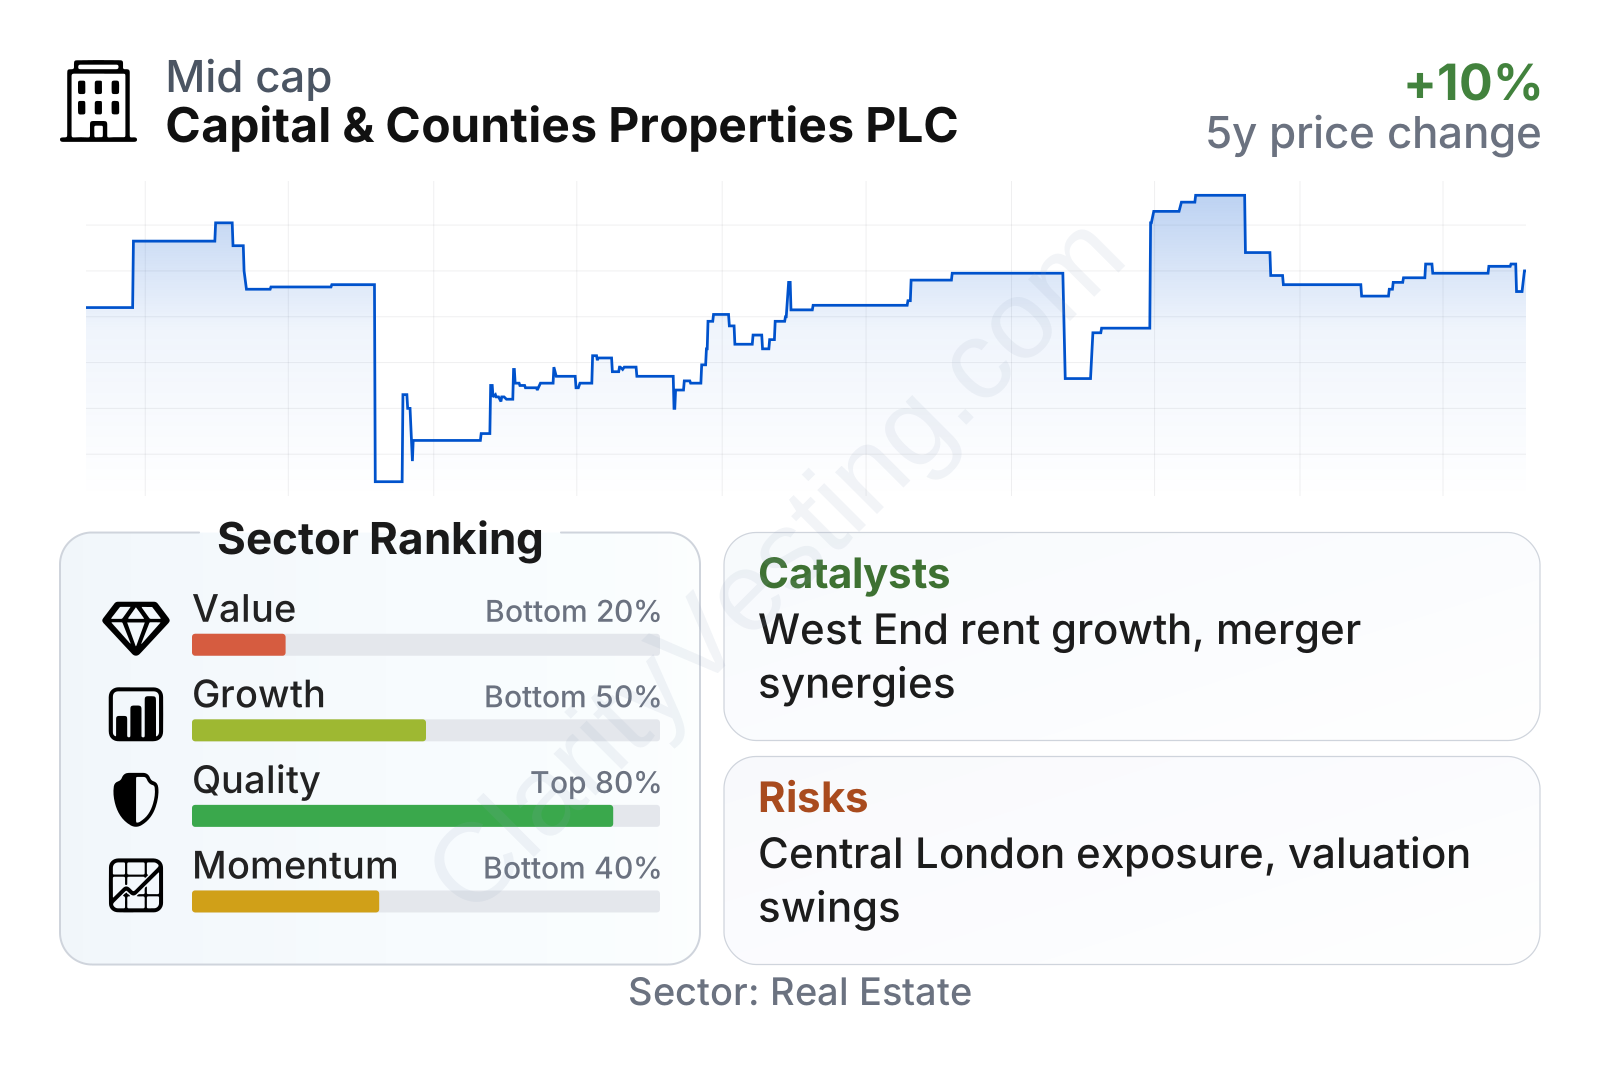
Capital & Counties Properties stands out more for balance-sheet strength and profitability than for classic growth or income appeal. It is a mid-sized real estate company, with share-price volatility close to the broader market. Relative to many real estate peers, leverage looks restrained: debt-to-equity is low, net debt is modest against assets and earnings, and interest coverage is slightly better than the sector median. Profitability metrics are unusually strong for a property owner, though that partly reflects valuation movements rather than only cash rent. By contrast, the value profile is mixed. The earnings multiple is low, but the dividend yield and free-cash-flow yield are below sector norms, and the price-to-book ratio now sits somewhat above the REIT sector median.
The stock chart shows a sharp drawdown in 2022 and early 2023, followed by a recovery that has been uneven rather than smooth. That pattern fits the company’s exposure to interest-rate expectations and London property sentiment.
Growth
The company operates in a sector with two very different forces at work. On one side, physical retail real estate remains structurally challenged in many markets because e-commerce and changing consumer habits have reduced demand for weaker locations. On the other side, prime urban destinations with tourism, luxury spending, dining, and entertainment have been more resilient. Capital & Counties Properties is positioned in the second category. Its assets are not ordinary retail boxes; they are pieces of dense city neighborhoods where shopping, dining, work, and leisure reinforce one another.
This strategic positioning makes sense for long-term growth because scarce central London real estate is difficult to replicate. New supply in these districts is limited by planning constraints, heritage protections, and high development costs. That gives established owners room to improve rents, upgrade tenant mix, and capture higher spending when visitor numbers and local activity rise.
A major strategic catalyst has been the integration of the larger combined London estate following the merger that created Shaftesbury Capital. The rationale is straightforward: larger scale in adjacent high-footfall districts can improve leasing power, operating efficiency, marketing reach, and redevelopment coordination. In property, scale matters most when it is clustered. A landlord controlling multiple neighboring blocks can shape a district more effectively than one owning isolated buildings.
Another support for future growth is the company’s relatively conservative leverage. Compared with many real estate peers, its debt load appears manageable. That matters in a higher-rate environment because it leaves more room to refinance, invest, or absorb weaker valuation periods without the same level of financial strain seen elsewhere in the sector.
Revenue per share improved steadily through 2024 before dropping back in 2025. That suggests the underlying business has been capable of growing, but not in a straight line. For a property company with asset sales, leasing transitions, and valuation effects, that kind of unevenness is not unusual. The broader takeaway is that growth exists, but it is tied to execution in a concentrated portfolio rather than to a wide geographic expansion plan.
The dividend trend has been positive over several years even though the latest year shows a pullback. That reflects a company emerging from a weaker period with improved cash generation, but still managing payouts with some caution. For long-term analysis, this looks more like a rebuilding distribution profile than a high-yield income vehicle.
Recent company reporting has also pointed to continued leasing activity, solid occupancy in core districts, and management focus on asset management and selective redevelopment. In practical terms, the strongest upside drivers are rising rental values in key West End locations, further operational benefits from the merged estate, and any improvement in property valuations if financing conditions become more favorable.
Risks
This article is for informational purposes only and does not constitute financial advice. Some content is AI-generated. See Disclaimer


