Stock Analysis · CNB Financial Corporation (CCNE)
Overview
CNB Financial Corporation is a regional bank holding company based in Pennsylvania. Through CNB Bank and related subsidiaries, it provides traditional banking services to consumers, small businesses, commercial clients, and public-sector customers. Its footprint is centered in Pennsylvania and Ohio, with additional operations in New York and Virginia, and it also has a meaningful banking-as-a-service and specialty lending presence beyond its branch network.
In simple terms, the company makes money mainly by gathering deposits, lending those funds at higher rates, and earning service fees from banking and wealth-related activities. Like most regional banks, its results are heavily influenced by interest rates, loan growth, funding costs, credit quality, and operating discipline.
Based on its recent annual filing, CNB Financial’s revenue mix is led by net interest income, with noninterest income representing a smaller but still useful contribution. Approximate sources of revenue are:
- Net interest income: about 74% to 76% of total revenue. This is the spread between interest earned on loans and securities and interest paid on deposits and borrowings.
- Other service charges and fees: about 7% to 9%. This includes deposit account fees, transaction-related charges, and general banking service income.
- Wealth management and trust revenue: about 4% to 6%. This comes from asset management, trust administration, and related advisory services.
- Loan servicing, card, and mortgage-related fees: about 3% to 5%. This includes servicing and transaction-based banking fees.
- Bank-owned life insurance and other noninterest income: about 8% to 10%. This category includes insurance-related income and several smaller fee-based items.
Over the last several years, revenue has expanded meaningfully, but a large part of that increase has also been accompanied by much higher interest expense as deposit and funding costs reset upward. That matters because for a bank, revenue growth alone does not automatically translate into stronger profitability.
The broad pattern is constructive on the top line: total revenue has risen strongly since 2021, while net income has remained positive through a difficult rate environment. The more important nuance is that funding costs climbed sharply in 2023 and 2024, which put pressure on margins even as revenue grew.
Key Figures
| Metric | Value | Sector ⓘ |
|---|---|---|
| Date | Oct 17, 2026 | |
| Context | ||
| Sector | Financial Services | |
| Industry | Banks - Regional | |
| Market Cap ⓘ | $985.78M | |
| Beta ⓘ | 0.61 | |
Value (Cheapness) | ||
| P/E Ratio ⓘ | 10.47 | 12.26 |
| P/B Ratio ⓘ | 1.08 | 1.23 |
| FCF Yield ⓘ | 8.70% | 10.40% |
| Dividend Yield ⓘ | 2.21% | 3.02% |
| EBIT / EV ⓘ | 12.76% | 8.14% |
| PEG ⓘ | 1.06 | |
Growth (Business expansion) | ||
| Revenue Growth ⓘ | 51.00% | 9.35% |
| RPS Growth (5Y CAGR) ⓘ | 7.18% | 12.19% |
| EPS Growth (5Y CAGR) ⓘ | -14.99% | -9.53% |
| BVPS Growth (5Y CAGR) ⓘ | 11.48% | 4.99% |
| Margin Growth (5Y Trend) ⓘ | -13.46% | -3.86% |
| FCF Growth (5Y CAGR) ⓘ | 2.84% | 4.81% |
| DPS Growth (5Y CAGR) ⓘ | -0.82% | 8.79% |
Quality (Business durability) | ||
| ROIC (Latest) ⓘ | 8.12% | 9.49% |
| ROE (Latest) ⓘ | 10.95% | 13.90% |
| ROA (Latest) ⓘ | 1.15% | 1.55% |
| ROIC (5Y Median) ⓘ | 8.74% | 7.86% |
| ROE (5Y Median) ⓘ | 11.11% | 12.17% |
| ROA (5Y Median) ⓘ | 1.03% | 1.30% |
| Net Debt / EBIT (Latest) ⓘ | 1.77 | 0.96 |
| Net Debt / EBIT (5Y Median) ⓘ | -2.60 | 0.73 |
| Net Debt / EBITDA (Latest) ⓘ | 1.60 | 0.92 |
| Operating Margin (Latest) ⓘ | 23.26% | 22.30% |
| Operating Margin (5Y Median) ⓘ | 22.31% | 24.63% |
| Debt to Equity (Latest) ⓘ | 30.82% | 58.56% |
| Profit Margin (Latest) ⓘ | 29.16% | 26.57% |
| Free Cash Flow (Latest) ⓘ | $85.72M | |
Momentum (Price trend) | ||
| 3Y Return ⓘ | +100.62% | +88.33% |
| 12M Return (excl. last month) ⓘ | +31.08% | +19.38% |
| 6M Return ⓘ | +16.29% | +4.75% |
| Price vs. 200-Day MA ⓘ | +8.79% | +3.50% |
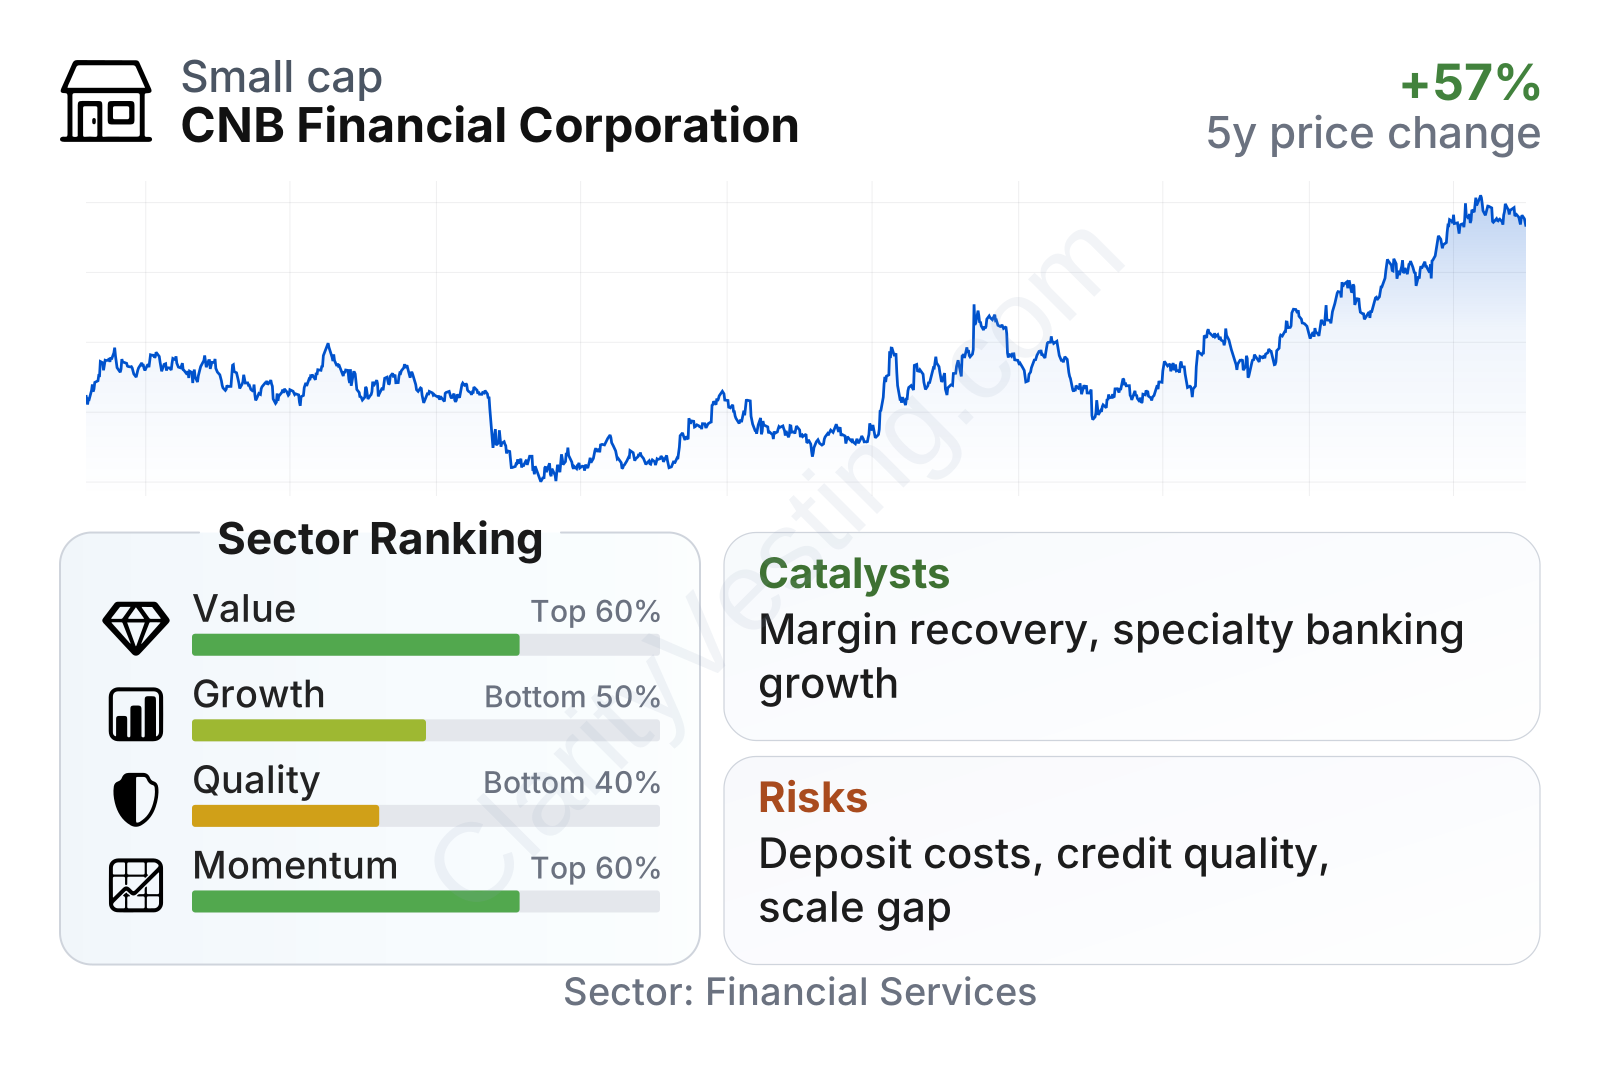
CNB Financial is a small regional bank with a market value just under $1 billion and a relatively low share-price volatility profile, reflected in a beta well below 1. On valuation, it screens somewhat cheaper than the sector median on both earnings and book value. Profitability is mixed: profit margin is healthy, but return on equity and return on assets remain below typical regional-bank medians. Growth signals are uneven, with a strong recent revenue rebound but weaker multi-year earnings growth. Share-price momentum has been better than the sector over the last 6 months, 12 months, and 3 years.
Growth
CNB Financial operates in a mature industry rather than a fast-growing one. Regional banking is not a high-growth sector in the way software or semiconductors can be, but it can still produce steady expansion through loan growth, market-share gains, acquisitions, fee businesses, and balance-sheet optimization. In that setting, the company’s long-term growth case depends less on disruption and more on disciplined execution.
A major part of the strategy is broadening revenue beyond plain-vanilla community banking. CNB has built specialty verticals such as banking-as-a-service, indirect and commercial lending capabilities, and wealth management operations. That approach makes strategic sense because it can widen the addressable market and support fee income, which is valuable when loan spreads are under pressure.
There are also signs of underlying franchise growth. Book value per share has increased at a solid pace over the last five years, well ahead of the sector median, which suggests capital has been compounded even during a choppy earnings period.
The earnings pattern is less smooth. EPS rose in 2022, then fell in 2023 and 2024 before improving in 2025. That volatility reflects exactly what investors have seen across many regional banks: higher funding costs and margin compression can interrupt what would otherwise look like a steady compounding business. For CNB, a sustained recovery in earnings likely requires deposit costs to stabilize, loan yields to remain firm, and credit losses to stay controlled.
The increase in book value per share is one of the more favorable long-term markers here. Even though earnings have been uneven, the company has continued to build net worth per share, which is important for banks because book value is a core anchor for balance-sheet strength and valuation.
Recent company communications in 2026 point to continued attention on deposit gathering, margin management, and expansion of specialized banking businesses. If those efforts produce better spread income without a notable rise in credit costs, they could become a meaningful earnings catalyst. Another supportive factor is that the company has already come through the post-2022 rate shock without the kind of franchise damage seen at weaker banks.
Risks
This article is for informational purposes only and does not constitute financial advice. Some content is AI-generated. See Disclaimer


