Stock Analysis · Chemours Co (CC)
Overview
Chemours is a specialty chemicals company spun out of DuPont in 2015. Its products are used in refrigeration and air conditioning, titanium dioxide pigments for coatings and plastics, semiconductor manufacturing, industrial cleaning, hydrogen-related applications, and other performance chemicals. In simple terms, Chemours sits in markets where customers need materials with very specific performance traits rather than basic commodity chemicals.
The company reports its business through three main segments. Based on its latest annual filing for 2025, revenue is spread across these activities in roughly the following order:
- Thermal & Specialized Solutions: about 35% of revenue. This segment includes refrigerants, thermal management fluids, foam-blowing agents, and specialty solvents sold under well-known brands such as Opteon and Freon.
- Titanium Technologies: about 34% of revenue. This business makes titanium dioxide pigment, a whitening and opacity material widely used in paints, coatings, plastics, and laminates.
- Advanced Performance Materials: about 31% of revenue. This segment includes fluoropolymers, industrial resins, membranes, and related materials used in electronics, transportation, energy, and industrial markets.
That mix matters because Chemours is not a single-product company. It has exposure to both cyclical industrial demand and more structural themes such as refrigerant transitions, advanced electronics, and energy applications. The challenge is that its portfolio also contains businesses with volatile pricing and raw-material sensitivity, especially titanium dioxide.
The longer-term financial picture shows a company whose sales have stayed in the roughly mid-$5 billion to high-$6 billion range over recent years, but with much sharper swings in profit than in revenue. That suggests Chemours’ earnings power depends heavily on margin recovery, cost discipline, and a better market backdrop rather than on rapid top-line expansion alone.
The operating profile improved strongly in 2021 and 2022, then weakened in 2023 and 2025 as gross profit narrowed and overhead plus interest costs absorbed a larger share of revenue. The broad takeaway is that Chemours can produce substantial earnings in favorable conditions, but its cost structure leaves less room for error when demand and pricing soften.
Key Figures
| Metric | Value | Sector ⓘ |
|---|---|---|
| Date | Oct 17, 2026 | |
| Context | ||
| Sector | Basic Materials | |
| Industry | Specialty Chemicals | |
| Market Cap ⓘ | $1.99B | |
| Beta ⓘ | 1.40 | |
Value (Cheapness) | ||
| P/E Ratio ⓘ | N/A | 16.90 |
| P/B Ratio ⓘ | N/A | 1.65 |
| FCF Yield ⓘ | 6.29% | 5.76% |
| Dividend Yield ⓘ | 2.61% | 2.13% |
| EBIT / EV ⓘ | -7.08% | 6.30% |
| PEG ⓘ | 1.60 | |
Growth (Business expansion) | ||
| Revenue Growth ⓘ | -1.50% | 11.10% |
| RPS Growth (5Y CAGR) ⓘ | 0.64% | 4.49% |
| EPS Growth (5Y CAGR) ⓘ | -43.31% | -13.47% |
| BVPS Growth (5Y CAGR) ⓘ | -28.71% | 5.51% |
| Margin Growth (5Y Trend) ⓘ | -13.71% | -1.54% |
| FCF Growth (5Y CAGR) ⓘ | -44.64% | 0.37% |
| DPS Growth (5Y CAGR) ⓘ | -14.56% | 6.08% |
Quality (Business durability) | ||
| ROIC (Latest) ⓘ | -6.30% | 9.26% |
| ROA (Latest) ⓘ | -4.13% | 4.91% |
| ROIC (5Y Median) ⓘ | 5.58% | 7.70% |
| ROA (5Y Median) ⓘ | 1.09% | 3.86% |
| Net Debt / EBIT (Latest) ⓘ | N/A | 1.40 |
| Net Debt / EBIT (5Y Median) ⓘ | 3.07 | 1.70 |
| Net Debt / EBITDA (Latest) ⓘ | N/A | 0.95 |
| Net Debt / Assets ⓘ | 48.24% | 13.69% |
| EBITDA / Interest ⓘ | N/A | 12.34 |
| Operating Margin (Latest) ⓘ | -6.97% | 13.20% |
| Operating Margin (5Y Median) ⓘ | 6.76% | 11.80% |
| Debt to Equity (Latest) ⓘ | -8408.16% | 40.56% |
| Profit Margin (Latest) ⓘ | -5.24% | 6.43% |
| Free Cash Flow (Latest) ⓘ | $125.00M | |
Momentum (Price trend) | ||
| 3Y Return ⓘ | -44.34% | +68.89% |
| 12M Return (excl. last month) ⓘ | -11.05% | +30.21% |
| 6M Return ⓘ | -43.34% | -4.16% |
| Price vs. 200-Day MA ⓘ | -29.70% | -1.27% |
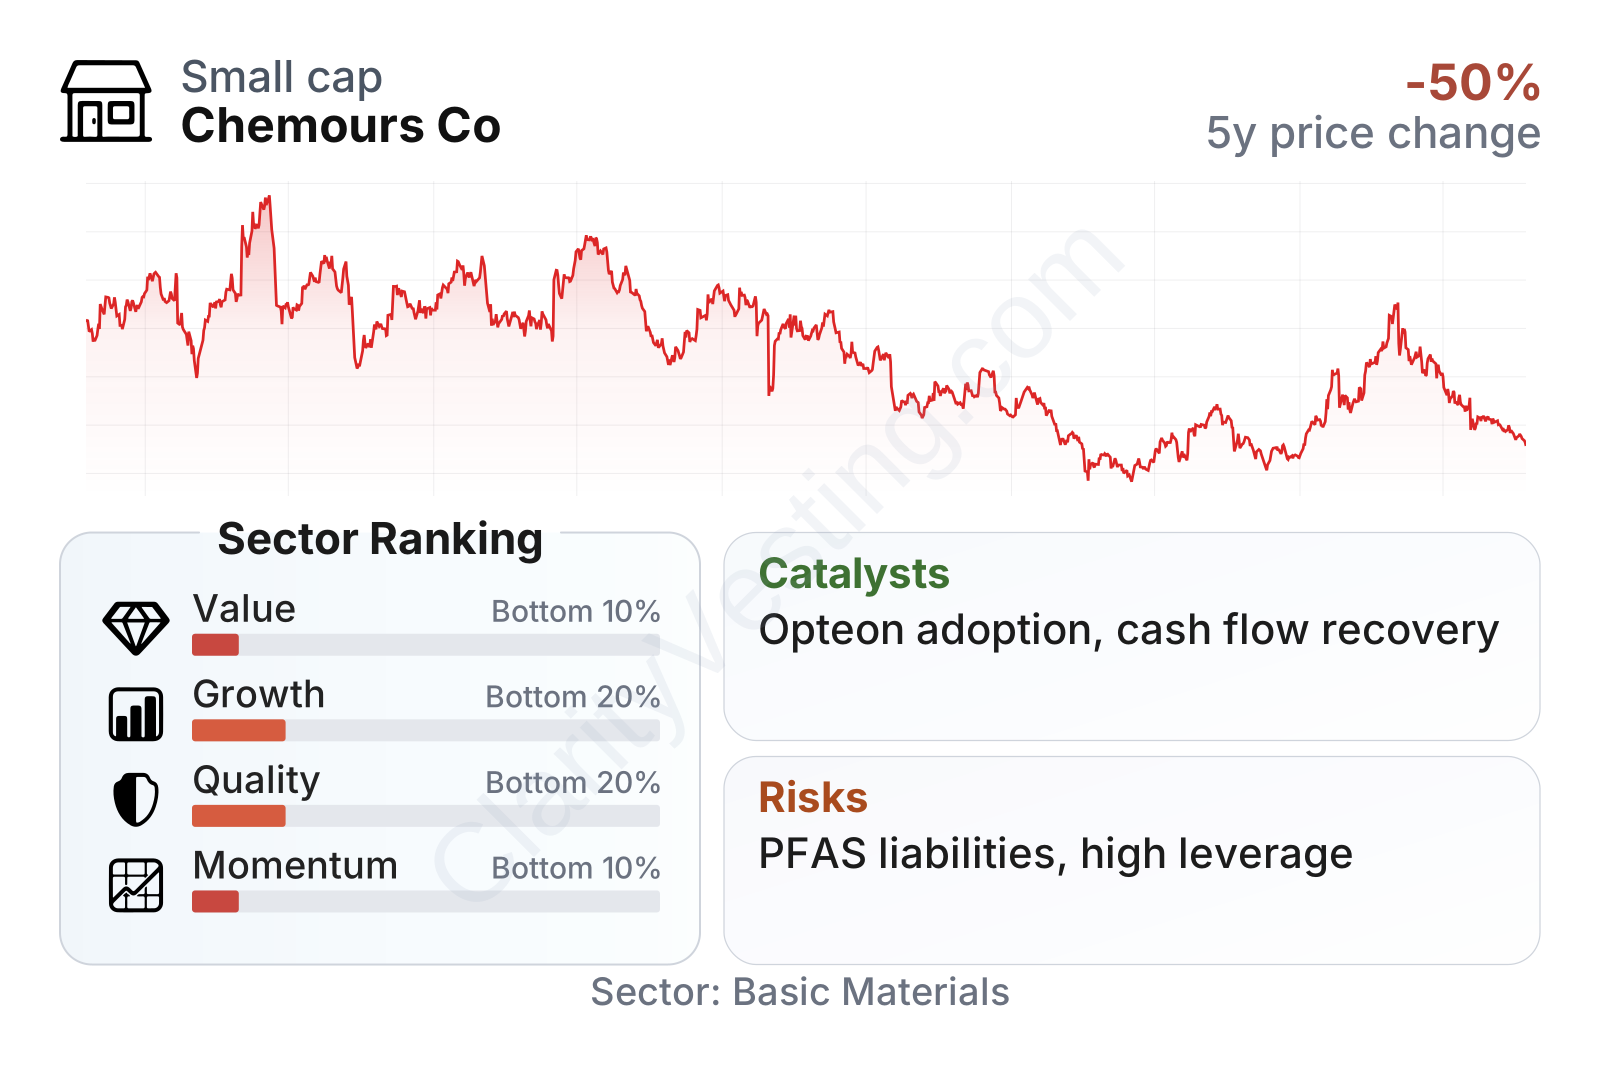
Chemours is a mid-sized chemicals company with a stock that has been much more volatile than the broader market, which fits its cyclical end markets and uneven profitability. The overall factor profile is weak relative to most peers: value ranks near the bottom of the sector because current earnings-based measures are distorted by losses, while growth, quality, and momentum also sit in the lower tier. Free cash flow yield and dividend yield look comparatively better, but those positives need to be viewed alongside negative returns on capital, weak margins, and a recent history of earnings pressure.
The share price history reflects that instability. After trading near the upper-$20s to low-$30s a few years ago, the stock fell sharply during the 2024–2025 downturn before partially rebounding in 2026. That pattern usually signals that the market is trying to price a recovery, but does not yet view the business as consistently back on track.
Growth
Chemours operates in several areas with credible long-term demand drivers, but the company’s growth profile is mixed. The most promising part is the refrigerants and thermal solutions franchise, where tighter environmental standards are gradually pushing customers toward lower-global-warming products. That gives Chemours a real opening because replacement cycles in cooling systems and refrigeration tend to last for years, not months. Parts of Advanced Performance Materials also benefit from durable themes such as semiconductor fabrication, high-performance industrial materials, hydrogen-related uses, and electrification-linked components.
By contrast, titanium dioxide is more cyclical. Demand is tied to construction, industrial production, and coatings activity, so this business can help results materially during a recovery but usually does not provide steady compounding growth on its own.
Recent revenue trends show that growth has been inconsistent. After strong post-pandemic gains, sales turned choppy and often negative on a year-over-year basis. The latest reading remains slightly negative and well below the sector median, which indicates that Chemours is still in a recovery phase rather than in a sustained expansion phase.
Cash generation tells a similar story. Free cash flow dropped from solid positive levels to a deep trough in 2025, then recovered back into positive territory in 2026. That rebound is important because it suggests the business still has the ability to generate cash when working capital and operating conditions normalize. For long-term analysis, this is one of the key signals to watch: if Chemours can turn that recovery into a steadier pattern, the investment case becomes materially stronger.
On strategy, management has continued to emphasize higher-value applications, portfolio simplification, productivity actions, and disciplined capital spending. That direction makes sense. Chemours is unlikely to become a high-growth chemicals company, but it does not need to. A more realistic path is moderate sales growth paired with improved margins and better cash conversion.
One meaningful recent development is the company’s continuing focus on Opteon refrigerants and related lower-emission technologies, helped by regulatory change in cooling markets. Another is ongoing work around advanced materials tied to electronics and energy uses. These are not guaranteed breakthroughs, but they are credible catalysts because they align with areas where customers face performance and compliance pressures.
Risks
This article is for informational purposes only and does not constitute financial advice. Some content is AI-generated. See Disclaimer


