Stock Analysis · CBIZ Inc (CBZ)
Overview
CBIZ Inc is a professional services company that helps businesses and individuals handle financial, accounting, tax, insurance, and workforce-related needs. It operates through a large national network in the United States and is best known for combining advisory work with recurring service lines such as benefits administration, payroll-related services, retirement plan support, and accounting. That mix matters because it gives the company exposure to both project-based work and repeat revenue tied to ongoing client relationships.
Following the combination with Marcum, CBIZ has become a meaningfully larger platform in business services. Its client base ranges from small and mid-sized businesses to larger organizations, with services often sold in bundles. That can make the business stickier than a single-product company, because a client using tax, accounting, employee benefits, and advisory support at the same time is less likely to switch providers quickly.
The company’s revenue comes from several service categories. Based on recent company reporting, the broad mix can be summarized as follows:
- Financial Services — approximately 55% to 65%: accounting, tax, attest, advisory, valuation, risk and transaction-related services. This segment became much larger after the Marcum transaction.
- Benefits and Insurance Services — approximately 20% to 30%: employee benefits brokerage, group health-related consulting, property and casualty insurance, and retirement-plan related services.
- National Practices and other recurring business services — approximately 10% to 20%: payroll, technology-enabled administrative support, healthcare consulting, and selected specialized advisory offerings.
Over the last several years, total revenue has expanded strongly, but profitability has been less smooth. Revenue grew from a little above $1.1 billion in 2021 to roughly $2.8 billion in 2025, showing the impact of acquisitions and scale expansion. At the same time, profit conversion has moved around more than sales, reflecting integration costs, higher interest expense, and margin pressure during the company’s transition to a larger operating base.
The revenue base has increased sharply since 2021, while the path from revenue to net income has been more uneven. A notable takeaway is that interest expense rose much faster than operating income for a period, which helps explain why the business looks stronger on revenue than on bottom-line earnings.
Key Figures
| Metric | Value | Sector ⓘ |
|---|---|---|
| Date | Oct 24, 2026 | |
| Context | ||
| Sector | Industrials | |
| Industry | Specialty Business Services | |
| Market Cap ⓘ | $3.02B | |
| Beta ⓘ | 0.92 | |
Value (Cheapness) | ||
| P/E Ratio ⓘ | 23.06 | 22.29 |
| P/B Ratio ⓘ | 1.72 | 1.98 |
| FCF Yield ⓘ | 9.58% | 6.26% |
| Dividend Yield ⓘ | N/A | 1.92% |
| EBIT / EV ⓘ | 7.38% | 4.83% |
| PEG ⓘ | 1.22 | |
Growth (Business expansion) | ||
| Revenue Growth ⓘ | -0.20% | 9.30% |
| RPS Growth (5Y CAGR) ⓘ | 20.67% | 7.76% |
| EPS Growth (5Y CAGR) ⓘ | 23.57% | -13.17% |
| BVPS Growth (5Y CAGR) ⓘ | 20.73% | 6.13% |
| Margin Growth (5Y Trend) ⓘ | 0.95% | 0.74% |
| FCF Growth (5Y CAGR) ⓘ | 9.48% | 10.79% |
| DPS Growth (5Y CAGR) ⓘ | 76.63% | 9.41% |
Quality (Business durability) | ||
| ROIC (Latest) ⓘ | 7.72% | 10.75% |
| ROA (Latest) ⓘ | 3.28% | 5.41% |
| ROIC (5Y Median) ⓘ | 8.85% | 9.37% |
| ROA (5Y Median) ⓘ | 4.39% | 4.95% |
| Net Debt / EBIT (Latest) ⓘ | 5.22 | 2.04 |
| Net Debt / EBIT (5Y Median) ⓘ | 3.08 | 2.27 |
| Net Debt / EBITDA (Latest) ⓘ | 4.11 | 1.39 |
| Net Debt / Assets ⓘ | 31.16% | 19.27% |
| EBITDA / Interest ⓘ | 3.55 | 9.58 |
| Operating Margin (Latest) ⓘ | 13.04% | 10.49% |
| Operating Margin (5Y Median) ⓘ | 9.72% | 10.30% |
| Debt to Equity (Latest) ⓘ | 76.02% | 64.82% |
| Profit Margin (Latest) ⓘ | 4.41% | 6.67% |
| Free Cash Flow (Latest) ⓘ | $288.77M | |
Momentum (Price trend) | ||
| 3Y Return ⓘ | +6.32% | +67.77% |
| 12M Return (excl. last month) ⓘ | +1.67% | +12.05% |
| 6M Return ⓘ | +77.16% | 0.00% |
| Price vs. 200-Day MA ⓘ | +36.86% | +0.67% |
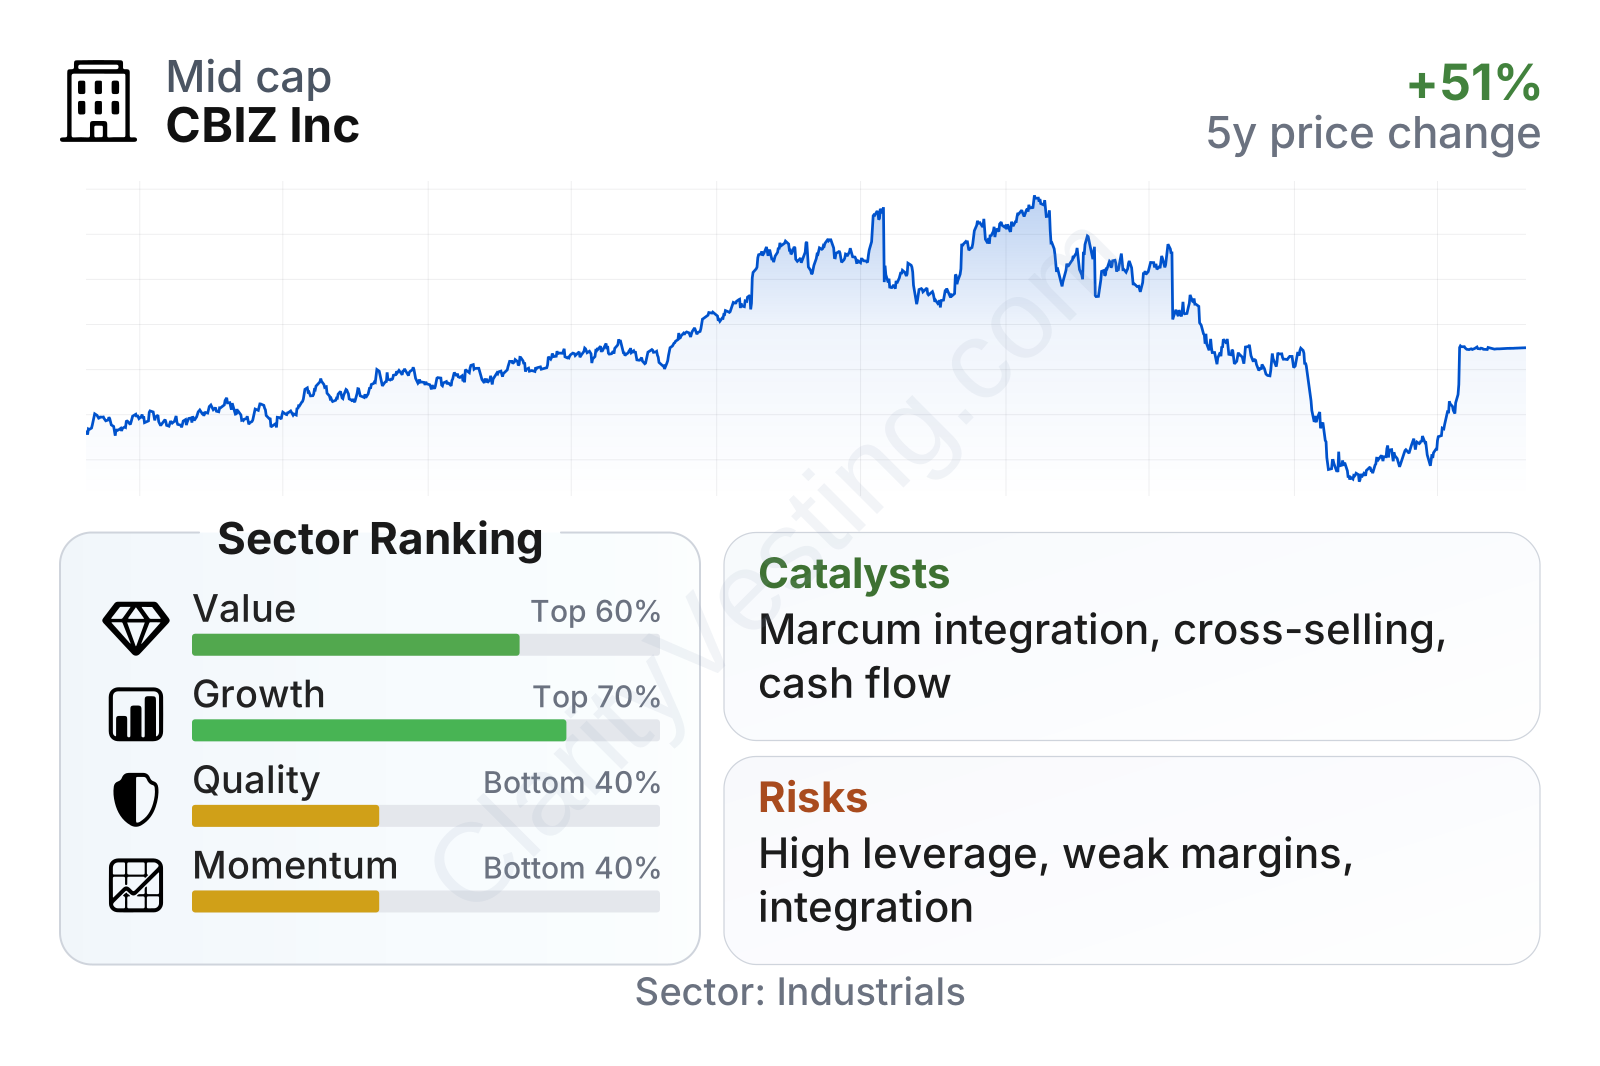
CBIZ sits in the mid-sized range by market value and has shown mixed characteristics. On valuation, the stock does not look broadly cheap on earnings alone, but free cash flow measures are stronger than the sector median. Growth metrics are helped by a solid five-year expansion record in revenue per share, earnings per share, and book value per share, even though the most recent year-over-year revenue comparison has slowed sharply. Quality is the weakest area relative to peers, mainly because leverage is high and interest coverage is thin for this sector. Price performance has also been volatile: long-term returns have lagged many peers, but the shorter-term rebound has been powerful.
Growth
CBIZ operates in a sector with favorable long-term demand drivers. Businesses continue to outsource accounting, compliance, employee benefits, insurance, and advisory tasks because regulations are complex, skilled labor is expensive, and many firms prefer external specialists instead of building everything in-house. That creates a supportive backdrop for companies that can offer multiple services under one brand.
The company’s strategy is logical for that environment. CBIZ has historically grown through acquisitions and cross-selling, and the Marcum combination significantly increased its scale in accounting and advisory work. A larger platform can help in several ways: it broadens the client base, improves recruiting appeal, expands geographic reach, and creates more chances to sell additional services to existing customers. In professional services, those network effects are not as dramatic as in software, but scale still matters because reputation, talent, and client coverage are major competitive factors.
Revenue growth was very strong through 2025, including a major step-up linked to acquisition activity, but the pace cooled substantially in 2026. That slowdown does not automatically mean the growth case is broken; it more likely shows that the company is now lapping a very large transaction and entering a period where integration and organic execution matter more than headline expansion.
Cash generation has improved meaningfully on a trailing basis, with free cash flow recently moving well above earlier levels. That is an important point for a service business because reported earnings can be affected by acquisition-related costs, while cash flow gives a clearer view of the company’s ability to support debt, fund smaller deals, and absorb integration work.
A current catalyst is the company’s larger post-merger footprint. If management executes well, the combined platform could produce more cross-selling in tax, attest, benefits, and insurance, while also improving back-office efficiency. Another positive factor is the persistent need for compliance and advisory support in healthcare, insurance, retirement, and financial reporting, areas that tend to remain necessary even when clients become more cautious on discretionary spending.
Risks
This article is for informational purposes only and does not constitute financial advice. Some content is AI-generated. See Disclaimer


