Stock Analysis · CBL & Associates Properties Inc (CBL)
Overview
CBL & Associates Properties Inc is a retail real estate investment trust focused on owning, leasing, and managing shopping destinations in the United States. Its portfolio is centered on enclosed malls, open-air centers, outlet properties, and related mixed-use assets, with a footprint that is largely concentrated in middle-market regions rather than the top coastal gateway markets. As a REIT, the company’s business model is relatively simple: it collects rent from tenants, works to keep occupancy stable, redevelops space when older tenants leave, and uses cash flow to cover interest, maintenance, redevelopment spending, and shareholder distributions.
The company’s revenue base comes mainly from recurring property income. Based on recent annual filings, the mix is dominated by rental and occupancy-related income, with smaller contributions from recoveries and other property-related items. The broad revenue picture can be summarized as follows:
- Base rent and tenant reimbursements: approximately 75% to 85% — lease payments from retailers, restaurants, entertainment tenants, and reimbursements for common-area maintenance, taxes, and insurance.
- Percentage rent, short-term leasing, and specialty leasing: approximately 5% to 10% — variable payments tied to tenant sales and temporary leasing activity such as kiosks or short-duration space.
- Other revenue: approximately 10% to 20% — parking, management-related income, outparcel activity, easements, and other ancillary property income, depending on the year and transaction activity.
In recent years, the business has looked more stable than many people might expect from a mall landlord. Revenue has not surged, but operating profitability has improved materially as the company has lowered financing pressure, worked through legacy issues, and extracted more earnings from a relatively steady top line. That matters because for a retail REIT, small changes in occupancy, rent spreads, and interest expense can have an outsized effect on net income.
The financial flow over the last several years shows a notable turnaround: revenue has remained in a fairly narrow band, while operating income and net income have improved sharply from earlier losses. Interest expense is still meaningful, but the company has moved from a stressed earnings profile to a much more profitable one, which is one of the most important changes in the current investment case.
Key Figures
| Metric | Value | Sector ⓘ |
|---|---|---|
| Date | Oct 17, 2026 | |
| Context | ||
| Sector | Real Estate | |
| Industry | REIT - Retail | |
| Market Cap ⓘ | $1.50B | |
| Beta ⓘ | 1.41 | |
Value (Cheapness) | ||
| P/E Ratio ⓘ | 7.06 | 17.38 |
| P/B Ratio ⓘ | 3.49 | 0.85 |
| FCF Yield ⓘ | 18.88% | 7.38% |
| Dividend Yield ⓘ | 3.76% | 4.85% |
| EBIT / EV ⓘ | 12.55% | 3.78% |
| PEG ⓘ | N/A | |
Growth (Business expansion) | ||
| Revenue Growth ⓘ | 4.00% | 5.30% |
| RPS Growth (5Y CAGR) ⓘ | N/A | 6.02% |
| EPS Growth (5Y CAGR) ⓘ | N/A | -11.37% |
| BVPS Growth (5Y CAGR) ⓘ | 34.91% | 0.45% |
| Margin Growth (5Y Trend) ⓘ | 119.00% | -0.22% |
| FCF Growth (5Y CAGR) ⓘ | 16.97% | 5.40% |
| DPS Growth (5Y CAGR) ⓘ | N/A | 5.02% |
Quality (Business durability) | ||
| ROIC (Latest) ⓘ | 17.04% | 5.69% |
| ROE (Latest) ⓘ | 53.96% | 7.56% |
| ROA (Latest) ⓘ | 8.06% | 2.85% |
| ROIC (5Y Median) ⓘ | 7.41% | 4.22% |
| ROE (5Y Median) ⓘ | 1.51% | 6.03% |
| ROA (5Y Median) ⓘ | 0.26% | 2.44% |
| Net Debt / EBIT (Latest) ⓘ | 4.56 | 7.59 |
| Net Debt / EBIT (5Y Median) ⓘ | 10.55 | 8.40 |
| Net Debt / EBITDA (Latest) ⓘ | 3.30 | 5.27 |
| Net Debt / Assets ⓘ | 73.29% | 37.76% |
| EBITDA / Interest ⓘ | 3.44 | 4.10 |
| Operating Margin (Latest) ⓘ | 72.01% | 35.29% |
| Operating Margin (5Y Median) ⓘ | 33.14% | 37.31% |
| Debt to Equity (Latest) ⓘ | 475.86% | 88.87% |
| Profit Margin (Latest) ⓘ | 36.96% | 19.61% |
| Free Cash Flow (Latest) ⓘ | $282.92M | |
Momentum (Price trend) | ||
| 3Y Return ⓘ | +189.99% | +30.75% |
| 12M Return (excl. last month) ⓘ | +77.91% | +4.36% |
| 6M Return ⓘ | +18.23% | -2.52% |
| Price vs. 200-Day MA ⓘ | +7.31% | -2.34% |
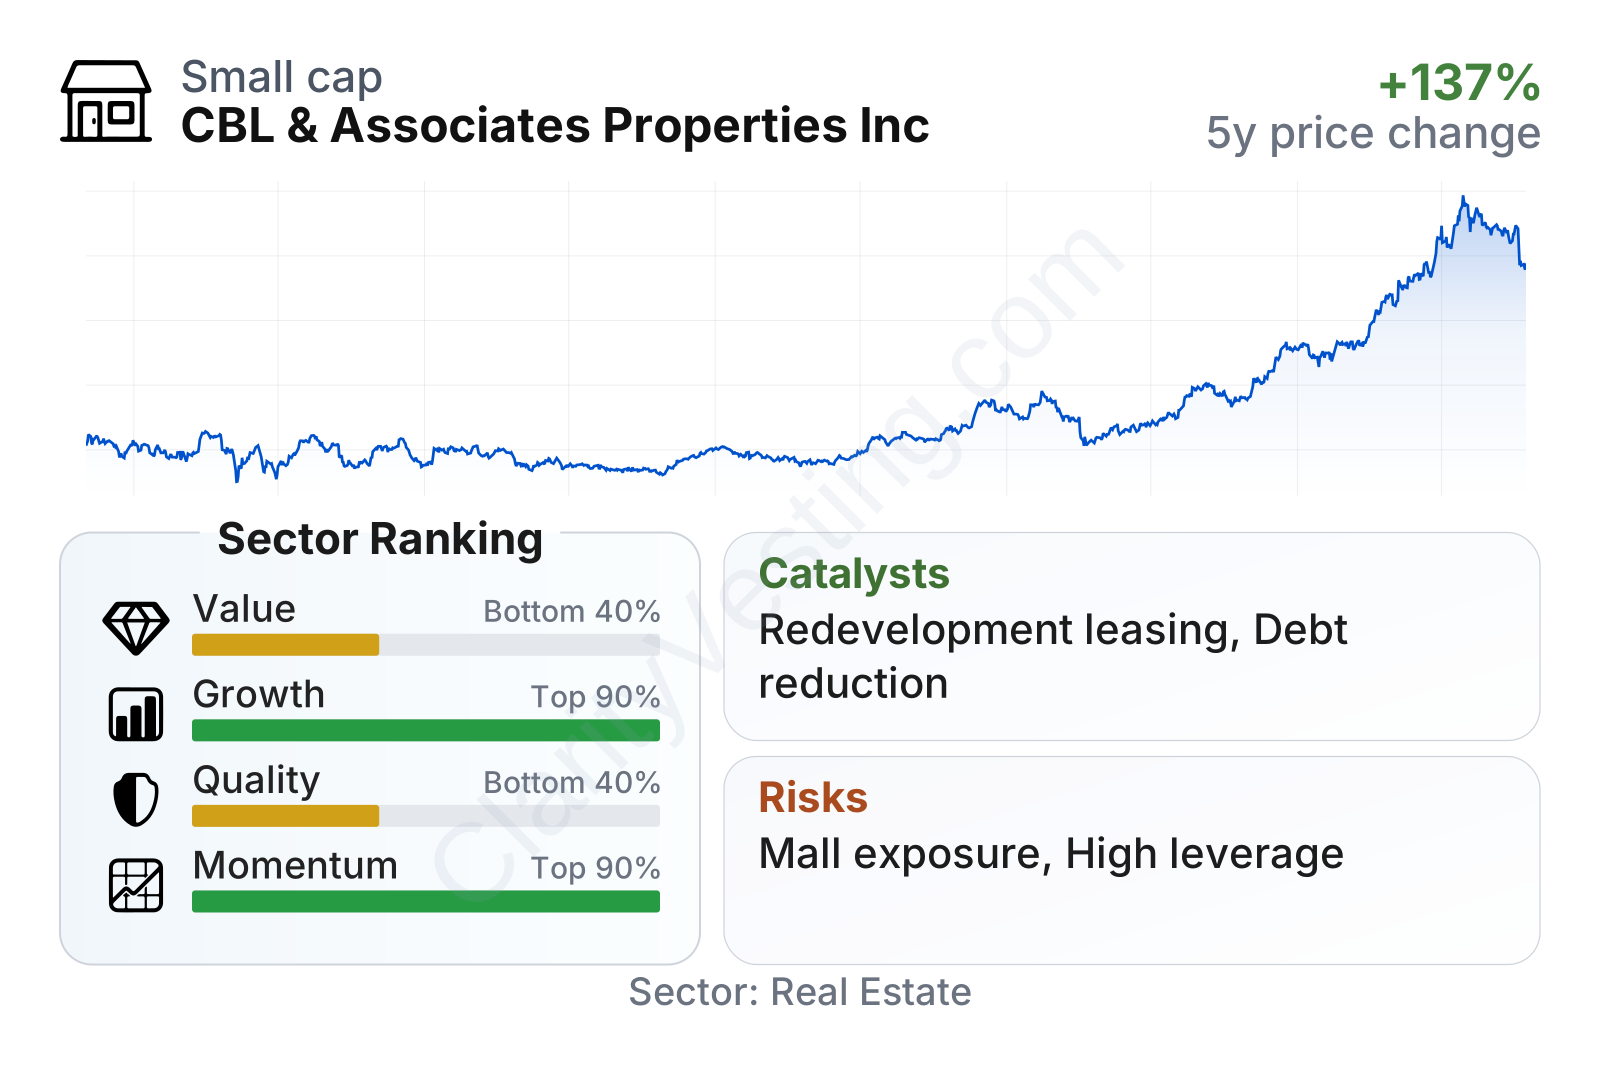
CBL is a mid-sized retail REIT with above-average share price volatility, reflected in a beta above 1.0. The metrics present a mixed but interesting profile. On one hand, the stock trades at a low earnings multiple relative to the real estate sector, and its cash generation metrics are strong, with free cash flow yield and EBIT relative to enterprise value well ahead of sector medians. On the other hand, traditional balance-sheet measures remain stretched, which drags down its overall quality and value ranking.
The company’s growth and momentum profile stands out much more favorably than its sector placement in value and quality. Profitability measures such as return on assets, return on invested capital, and operating margin are currently strong, and recent price performance has been far stronger than the typical real estate stock. That combination suggests the market has been rewarding an operational recovery rather than simply assigning a low multiple to a stagnant landlord.
Growth
CBL operates in a sector that is no longer viewed as a natural growth engine. Mall real estate faces structural pressure from e-commerce, changing consumer behavior, and tenant bankruptcies. That said, the company is not relying on broad sector expansion. Its path is based more on repositioning existing properties, replacing weaker tenants with off-price retailers, restaurants, fitness, entertainment, and services, and selectively redeveloping underused space. In other words, this is a recovery-and-optimization strategy rather than a classic high-growth expansion model.
A key point in CBL’s favor is that this strategy has shown measurable progress. Revenue per share has been relatively steady after the post-restructuring period, which indicates the portfolio is producing a consistent level of income even without major acquisition activity.
That stability matters because it suggests the recent earnings improvement has not depended solely on temporary accounting effects. Instead, a combination of operating discipline, property-level leasing progress, and a better financing profile appears to be supporting results. In retail real estate, a flat or modestly rising revenue base can still produce solid bottom-line growth if vacant space is leased more efficiently and financing costs become less burdensome.
The dividend profile is also relevant to growth analysis because REITs are often judged by their ability to sustain and rebuild distributions. CBL’s dividend history has been uneven since its restructuring, but the more recent trend shows a resumed payout and some rebuilding from lower levels.
The main catalysts now are internal rather than macro-driven. Leasing former department store boxes, adding nontraditional tenants, and using mixed-use or entertainment concepts to increase traffic can lift property productivity. If management continues improving occupancy and tenant mix while keeping redevelopment spending disciplined, cash flow growth can outpace revenue growth. Another meaningful opportunity is continued debt reduction, because every improvement in leverage can enhance financial flexibility and reduce the drag from interest expense.
Recent company communications and filings have continued to emphasize leasing activity, redevelopment initiatives, and capital allocation discipline. For a business like CBL, those are the developments that matter most: not flashy expansion, but evidence that legacy mall space can keep being converted into productive and more resilient uses.
Risks
This article is for informational purposes only and does not constitute financial advice. Some content is AI-generated. See Disclaimer


