Stock Analysis · Commonwealth Bank of Australia (CBAUF)
Overview
Commonwealth Bank of Australia is one of the largest banks in Australia. It provides everyday banking, home loans, business lending, institutional banking, payments, wealth-related services, and insurance distribution. In simple terms, it makes money mainly by taking deposits, lending those funds at higher rates, charging fees for banking services, and earning income from business and institutional clients.
The group’s revenue base is still centered on traditional banking, especially retail and business banking in Australia. Based on the company’s segment reporting in recent annual materials, the business mix is approximately structured as follows:
- Retail Banking Services: about 35% to 40% of operating income. This includes home loans, personal lending, credit cards, transaction accounts, and deposits for households.
- Business Banking: about 25% to 30%. This covers lending, deposits, and banking services for small and medium-sized businesses and agribusiness customers.
- Institutional Banking and Markets: about 15% to 20%. This includes transaction banking, large corporate lending, markets activities, and risk management solutions for bigger clients.
- New Zealand banking: about 10% to 15%. This is the group’s banking operation in New Zealand.
- Other income streams: below 10%. These include funds management-related activities, insurance distribution, and treasury or support functions.
For a bank, the most important economic driver is not product volume alone but the spread between what it earns on loans and what it pays on deposits and funding. That means profitability depends heavily on lending margins, deposit franchise strength, credit quality, and operating efficiency. Commonwealth Bank stands out because it has a very large household customer base in Australia, which supports low-cost deposits and gives it room to cross-sell multiple financial services.
The business profile also looks relatively defensive. Australian home lending and transaction banking are mature markets, but they tend to generate recurring income. That does not remove cyclical risk, yet it makes the bank less dependent on one-off activities than many more capital-markets-focused financial firms.
The long-term pattern shows a business that has kept revenue and operating income broadly resilient, while net income has remained strong even through periods of margin pressure and higher funding costs. One figure to treat carefully is total revenue for 2025, which appears unusually high relative to surrounding years and may reflect classification effects rather than a pure underlying jump. The broader picture is that profits have stayed in a high range, supported by scale and a strong domestic franchise.
Key Figures
| Metric | Value | Sector ⓘ |
|---|---|---|
| Date | Oct 03, 2026 | |
| Context | ||
| Sector | Financial Services | |
| Industry | Banks - Diversified | |
| Market Cap ⓘ | $178.12B | |
| Beta ⓘ | 0.80 | |
Value (Cheapness) | ||
| P/E Ratio ⓘ | 23.31 | 12.60 |
| P/B Ratio ⓘ | 1.57 | 1.23 |
| FCF Yield ⓘ | -50.94% | 10.16% |
| Dividend Yield ⓘ | 4.74% | 2.96% |
| EBIT / EV ⓘ | N/A | 7.77% |
| PEG ⓘ | 3.47 | |
Growth (Business expansion) | ||
| Revenue Growth ⓘ | 6.50% | 9.50% |
| RPS Growth (5Y CAGR) ⓘ | 16.61% | 12.10% |
| EPS Growth (5Y CAGR) ⓘ | 9.06% | -9.45% |
| BVPS Growth (5Y CAGR) ⓘ | 14.32% | 5.01% |
| Margin Growth (5Y Trend) ⓘ | -1.03% | -4.07% |
| FCF Growth (5Y CAGR) ⓘ | N/A | 4.96% |
| DPS Growth (5Y CAGR) ⓘ | 18.97% | 8.79% |
Quality (Business durability) | ||
| ROIC (Latest) ⓘ | 6.51% | 9.60% |
| ROE (Latest) ⓘ | 27.31% | 13.84% |
| ROA (Latest) ⓘ | 1.52% | 1.53% |
| ROIC (5Y Median) ⓘ | 3.88% | 7.86% |
| ROE (5Y Median) ⓘ | 13.79% | 12.20% |
| ROA (5Y Median) ⓘ | 0.78% | 1.29% |
| Net Debt / EBIT (Latest) ⓘ | 9.66 | 0.91 |
| Net Debt / EBIT (5Y Median) ⓘ | 11.05 | 0.74 |
| Net Debt / EBITDA (Latest) ⓘ | 9.09 | 0.97 |
| Operating Margin (Latest) ⓘ | 19.13% | 22.12% |
| Operating Margin (5Y Median) ⓘ | 53.06% | 24.39% |
| Debt to Equity (Latest) ⓘ | 391.60% | 60.37% |
| Profit Margin (Latest) ⓘ | 37.00% | 26.62% |
| Free Cash Flow (Latest) ⓘ | -$90.74B | |
Momentum (Price trend) | ||
| 3Y Return ⓘ | +95.27% | +89.23% |
| 12M Return (excl. last month) ⓘ | +22.46% | +17.35% |
| 6M Return ⓘ | -11.09% | +10.00% |
| Price vs. 200-Day MA ⓘ | +31.75% | +3.73% |
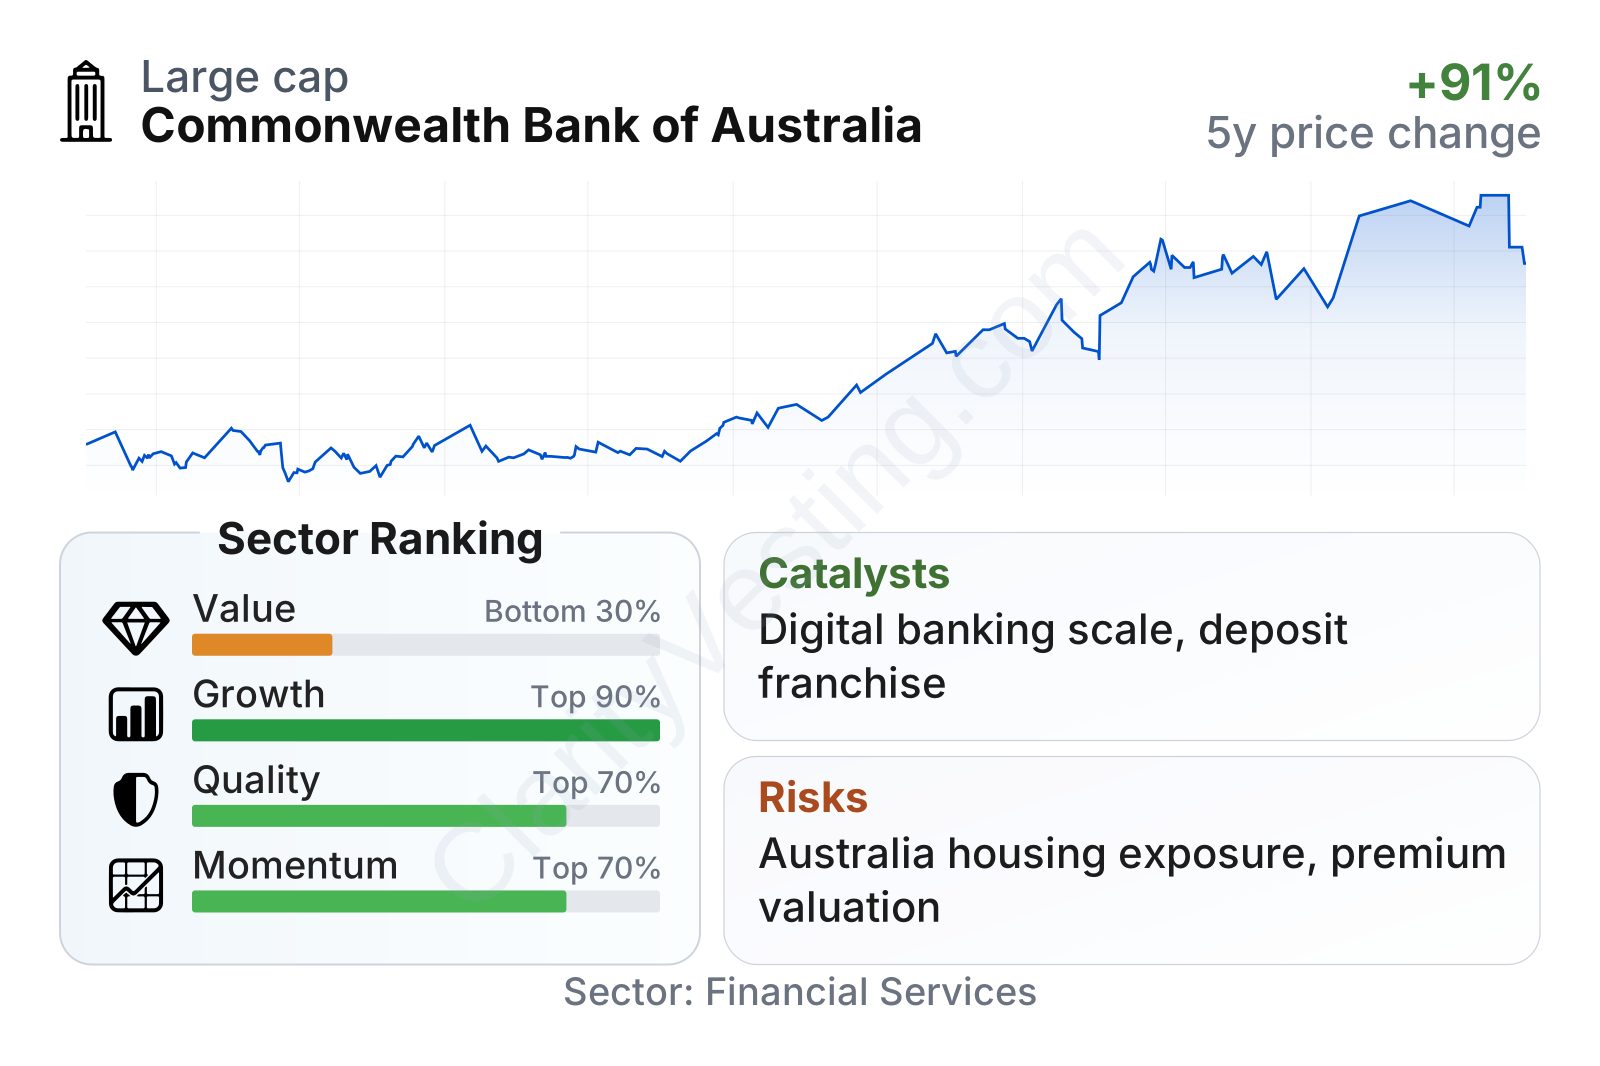
Commonwealth Bank is a very large bank with relatively low share-price volatility, reflected in a beta below 1. On growth and quality, the overall profile is solid: five-year revenue per share, earnings per share, book value per share, and dividends all compare well with much of the broader financial sector. Profitability is also strong, with return on equity clearly above the sector median and profit margin comfortably above peers.
The weaker area is valuation. The stock trades at a noticeably higher earnings multiple than the sector median, and its price-to-book ratio is also above peers. That premium suggests the market is recognizing the bank’s scale, franchise quality, and consistency, but it also leaves less room for disappointment if earnings growth slows.
One accounting point matters for banks: free cash flow is often not very useful in the same way it is for industrial or software companies because lending and deposit flows can distort the number. For that reason, capital strength, margins, returns on equity, and credit quality usually say more about banking performance than free cash flow yield alone.
Growth
Banking in Australia is not a fast-growth industry in the way cloud software or semiconductors can be, but it is a large and structurally important sector with steady long-term demand. Population growth, housing finance, transaction banking, digital payments, and business credit all support continued expansion over time. That makes Commonwealth Bank more of a compounding financial franchise than a high-growth disruptor.
The company’s strategy for future growth is logical. It has invested heavily in digital banking, customer data, fraud controls, cloud and platform modernization, and artificial intelligence tools to improve service and lower costs. For a large incumbent bank, technology spending can defend market share, improve efficiency, and deepen customer relationships rather than simply chase new revenue. This matters because scale advantages in banking increasingly depend on digital engagement as much as branch networks.
A key catalyst is the strength of its deposit and home-lending franchise. Commonwealth Bank has long held a leading position in Australian retail banking, and that scale can translate into better economics over time if it keeps attracting low-cost deposits and maintaining customer activity across accounts, cards, mortgages, and payments.
Even without a displayed earnings trend here, the broader financial profile points to respectable earnings compounding over the past five years. Earnings per share growth has been positive while a large part of the sector has been weaker on that measure. That suggests the bank has not simply benefited from short-term rate conditions; it has also translated its franchise strength into durable shareholder economics.
The increase in book value per share has been especially notable, accelerating sharply in the most recent period. For a bank, book value matters because it reflects the capital base supporting future lending and profit generation. A rising book value per share, combined with strong returns on equity, usually points to a business that is adding value internally rather than only relying on external growth.
Recent company reporting has also highlighted continued technology investment, disciplined expense management, and ongoing capital returns through dividends. In addition, a more normal interest-rate environment than the ultra-low-rate period of earlier years can still be supportive for banking profitability, provided deposit competition and bad debt expenses remain under control.
Risks
This article is for informational purposes only and does not constitute financial advice. Some content is AI-generated. See Disclaimer


